Binance Coin Price Analysis BNB / USD: Pulling Back
BNB Is attempting to set a new record, downwards.

Share this article
- Binance Coin has fallen to its weakest trading level since March 2019
- The daily frame shows that the $10.00 level is the likely bearish target.
- The cryptocurrency has lost over sixty-five percent from its current yearly trading high.
Binance Coin remains under heavy downside pressure as the month of September ends, with the BNB / USD pair on course for a fourth consecutive month of trading losses. At current trading levels, the cryptocurrency trades down by over thirty-five percent on a monthly basis.
With the entire digital currency market in decline, the path of least resistance is still to the downside, with various time frames still indicating further double-digit losses ahead for the cryptocurrency.
The eight-largest cryptocurrency by market capitalization has eroded over sixty-five percent in value since its 2019 price peak, although it is still trading over one-hundred and fifty percent higher since the start of 2019.
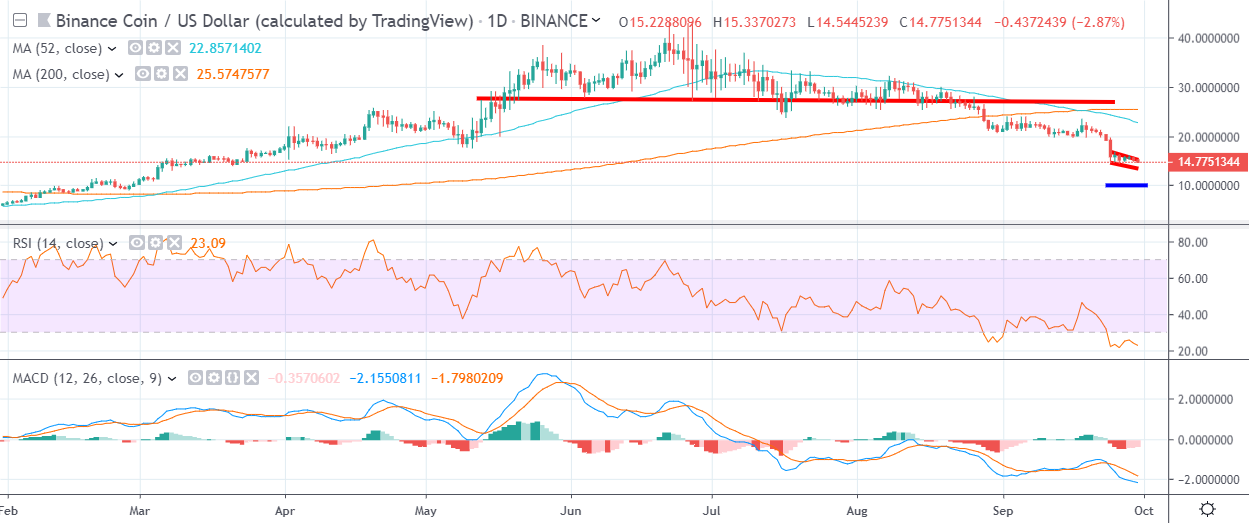
A large head and shoulders pattern on the daily time frame was triggered at the end of August, further encouraging traders to short the BNB / USD pair. The daily time frame is currently suggesting the BNB / USD pair could fall as far as the $10.00 level.
The daily time frame also shows that a bearish death-cross is currently underway, while the RSI indicator on the daily time is now at its most oversold level since November 2018.
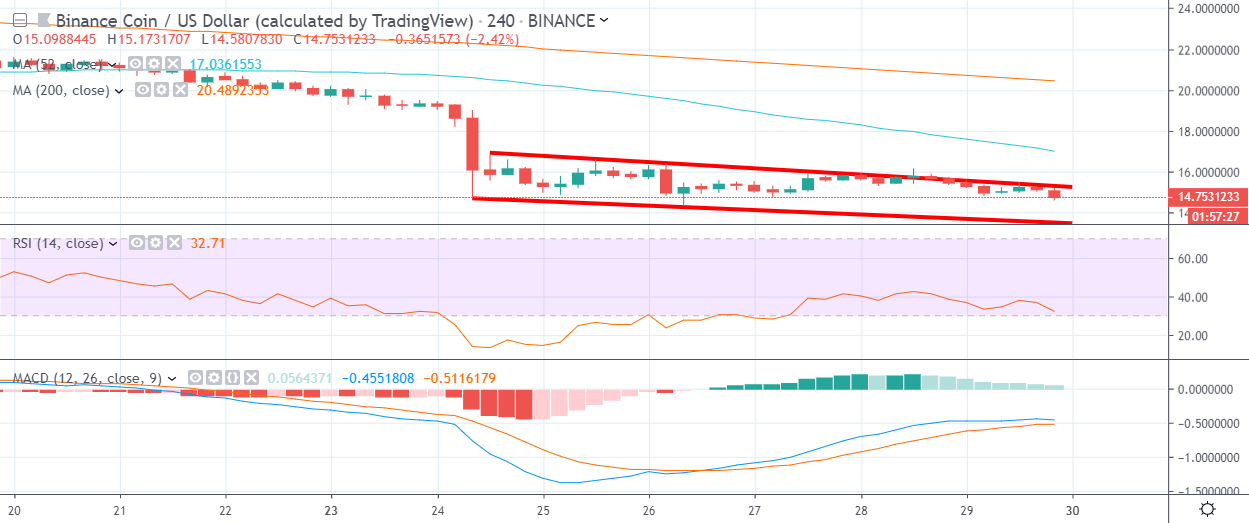
Bullish MACD price divergence created during the September 22nd to September 24th decline suggests that a strong upside rally could occur once the BNB / USD pair reaches its overall downside target.
According to the latest sentiment data from TheTIE.io, the short-term sentiment towards Binance Coin is bearish, at 40.00 %, while the overall long-term sentiment towards the cryptocurrency is neutral, at 55.00%.
Upside Potential
The four-hour time frame highlights a descending price channel, with the $15.50 level the top of the price channel. The mentioned time frame also shows that the cryptocurrency will need to reclaim the $17.00 level to reclaim its short-term bullish status.
The daily time frame highlights the $17.00 as a key resistance level, while the BNB / USD pair will need to move above the $26.60 level to turn technically bullish again.
Downside Potential
The BNB / USD pair’s multi-month trading low, at $14.35, is currently the strongest form of short-term support, prior to the bottom-end of the descending price channel on the four-hour time frame, at $13.50.
The daily time frame is currently showing that the recently triggered bearish head and shoulders pattern is nearing completion, with the $10.00 level the overall bearish target.
Summary
Binance Coin is still under tremendous downside pressure and looks set to post its fourth-straight month of losses.
The daily time frame strongly suggests that the BNB / USD pair may fall towards the $10.00 level before a sustainable upside recovery takes place.
Check out our coin guide for BNB to understand how it works.
We also conducted a deep analysis of the Binance Exchange token in our DARE.
Share this article
