
Binance Coin Price Analysis BNB / USD: Target Reached
Binance Coin has toned down its bullish momentum.
- Binance Coin has a bullish short-term bias, with the cryptocurrency still trading above key technical support
- The BNB / USD pair has bullish medium-term outlook and continues to trade above its 200-day moving average
- The daily time frame is highlighting that a valid bullish breakout is still underway
Binance Coin / USD Short-term price analysis
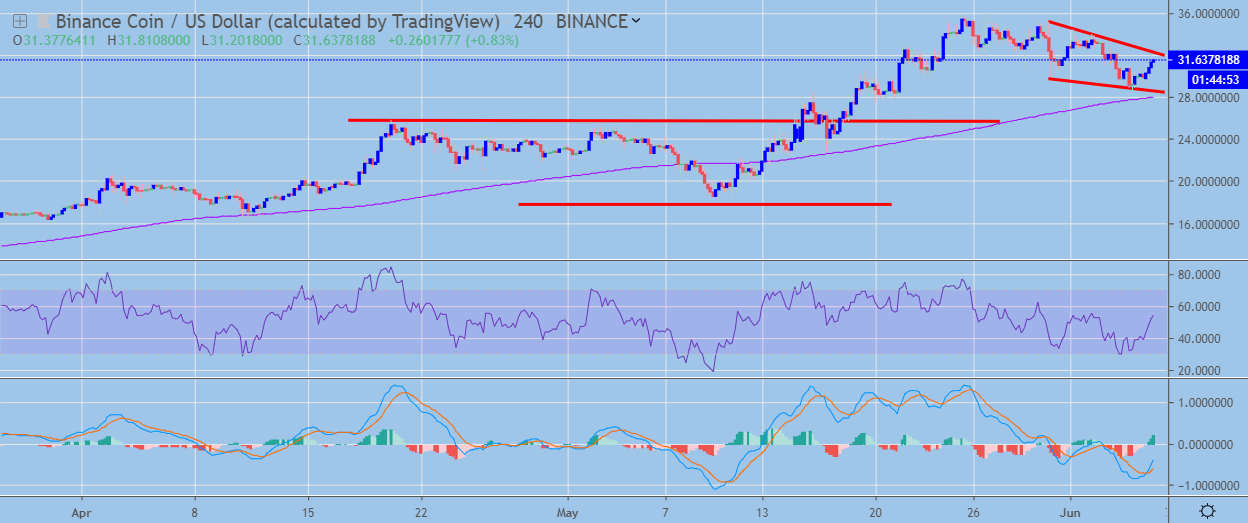
Binance Coin has a bullish short-term trading bias, with the cryptocurrency still trading above its key 200-period moving average on the four-hour time frame.
The four-hour time frame shows that the bullish inverted head and shoulders pattern has now reached its full upside projection. The mentioned time frame is also showing that the short-term dynamics for the BNB / USD pair have changed, with price now creating lower lows.
Technical indicators on the four-hour time frame are however bullish and continue to issue a buy signal.
 BNB / USD H4 Chart by TradingView
Pattern Watch
Traders should note that a small bullish wedge pattern can also be seen on the four-hour time frame.
Relative Strength Index
The RSI Indicator has also turned bullish on the four-hour time frame and shows scope for further upside.
MACD Indicator
The MACD indicator on the four-hour time frame is bullish, with both the MACD histogram and signal line generating a buy signal.
Binance Coin / USD Medium-term price analysis
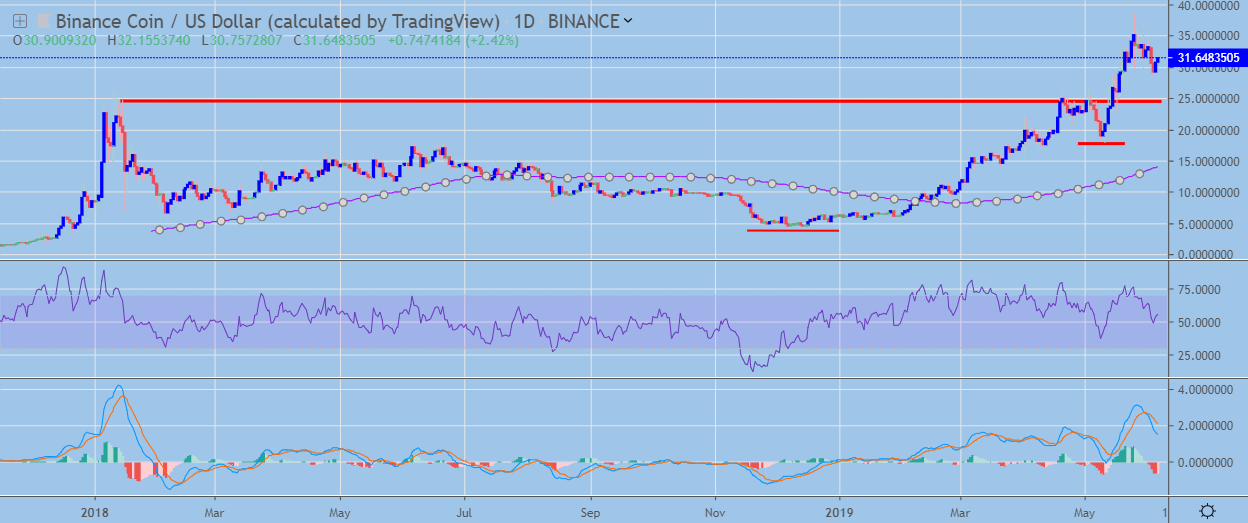
Binance Coin has an increasingly bullish medium-term outlook, with the BNB / USD pair still trading well above its 200-day moving average.
The daily time frame is showing that a bullish technical breakout is still underway, with the large inverted head and shoulders pattern yet to reach its full upside potential.
Technical indicators are mixed on the daily time frame and are failing to generate a clear trading signal.
 BNB / USD Daily Chart by TradingView
Pattern Watch
Traders should note that the neckline of the inverted head and shoulders pattern is now acting as major technical support on the daily time frame.
Relative Strength Index
The RSI indicator is bullish on the daily time frame and is starting to turn higher.
MACD Indicator
The MACD indicator on the daily time frame is bearish and continues to issue a sell signal.
Conclusion
Binance Coin has once again started to find buying interest after staging a swift technical reversal from its all-time record price high.
Bulls need to change the short-term dynamics of the BNB / USD pair and start creating higher price highs again or the cryptocurrency could trade back towards neckline support on the daily time frame.
Check out our coin guide for BNB to understand how it works.
We also conducted a deep analysis of the Binance Exchange token in our DARE.