
Binance Coin Price Analysis BNB / USD: Top Gun ATH
Ongoing developments fuel a token on afterburners.
- Binance Coin has a bullish short-term bias, with the cryptocurrency attempting to recover back towards its all-time trading high
- The four-hour time frame is showing that a bullish wedge breakout has occurred
- The daily time frame is highlighting that bulls need to invalidate a bearish double-top pattern formation
Fundamental Analysis
Binance Сoin continues its trend up as the exchange accelerates its pace of developments. Binance is already actively testing margin trading and opening more fiat on-ramps for the BNB token. This will further attract users and liquidity to the exchange which should have a positive effect on its token price.
Binance Coin / USD Short-term price analysis
Binance Coin has a bullish short-term trading bias, with the cryptocurrency attempting to move back towards its all-time trading high.
The four-hour time frame shows that a strong bullish breakout has occurred from a falling wedge pattern, with the upside projection of the pattern located close to the May 2019 trading high.
Technical indicators on the four-hour time frame have turned bullish and continue to issue a buy signal.
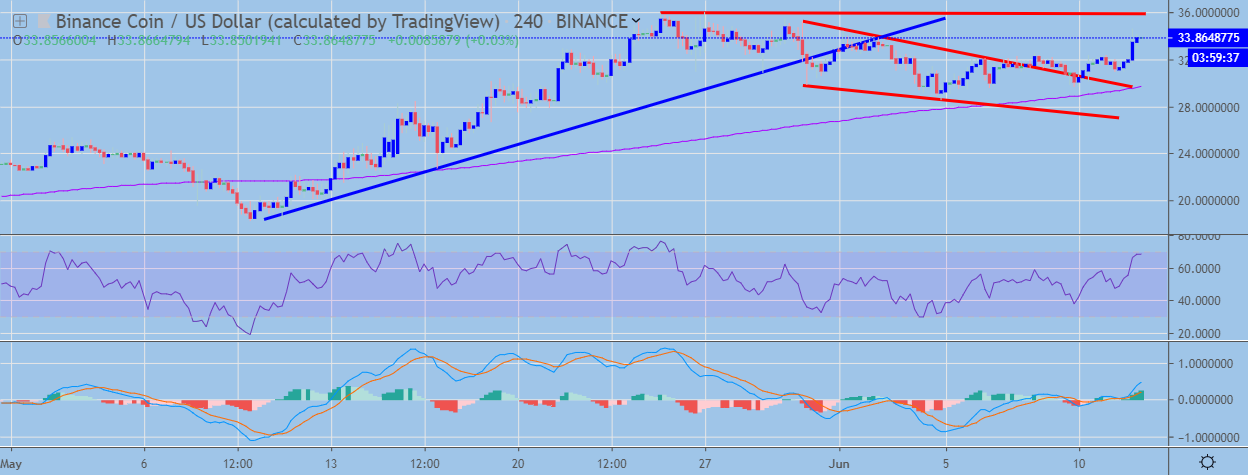 BNB / USD H4 Chart by TradingView
Pattern Watch
Traders should note that a bullish inverted head and shoulders pattern may start to take shape across the four-hour time frame if buyers can rally the BNB / USD pair towards the May 2019 trading high.
Relative Strength Index
The RSI indicator is bullish on the four-hour time frame, although it is approaching overbought territory.
MACD Indicator
The MACD indicator on the four-hour time frame is bullish, with both the MACD histogram and signal line generating strong buy signals.
Binance Coin / USD Medium-term price analysis
Binance Coin has a bullish medium-term outlook, with the cryptocurrency still enjoying strong dip-buying demand on the daily time frame.
The daily time frame is showing that a double-top pattern formation has taken shape, with BNB / USD bulls now needing to invalidate the bearish pattern to negate medium-term selling pressures.
Technical indicators are mixed on the daily time frame and currently have a neutral trading bias.
 BNB / USD Daily Chart by TradingView
Pattern Watch
Traders should note that the downside target of the bearish double-top pattern on the daily time frame is located close to the May 2019 monthly trading low.
Relative Strength Index
The RSI indicator has turned bullish on the daily time frame and continues to issue a strong buy signal.
MACD Indicator
The MACD indicator on the daily time frame is conflicted, with the MACD signal line still crossing lower while the MACD histogram is correcting higher.
Conclusion
Binance coin has performed a strong technical breakout on the four-hour time frame, with bulls now targeting towards the BNB / USD pair’s all-time trading high.
The daily time frame highlights that buyers need to create a major new price high or the cryptocurrency could start to come under another round of selling pressure.
Check out our coin guide for BNB to understand how it works.
We also conducted a deep analysis of the Binance Exchange token in our DARE.