 Earn with Nexo
Binance Coin / USD Technical Analysis: Charging Through
The pair is set to break through all of its trading highs, going as far as January 2018.
- Binance Coin is bullish in the short-term, with the cryptocurrency trading above key neckline support
- The daily time frame shows a bullish breakout in progress
- Binance Coin bulls look set to target the BNB / USD pair’s all-time trading high
Binance Coin / USD Short-term price analysis
Binance Coin has a strong bullish short-term trading bias, with the cryptocurrency moving towards a fresh yearly trading high.
The four-hour time frame shows that buyers have moved price above the neckline of an inverted head and shoulders pattern with a sizeable upside projection.
Technical indicators on the four-hour time frame are bullish and are currently issuing a strong buy signal.
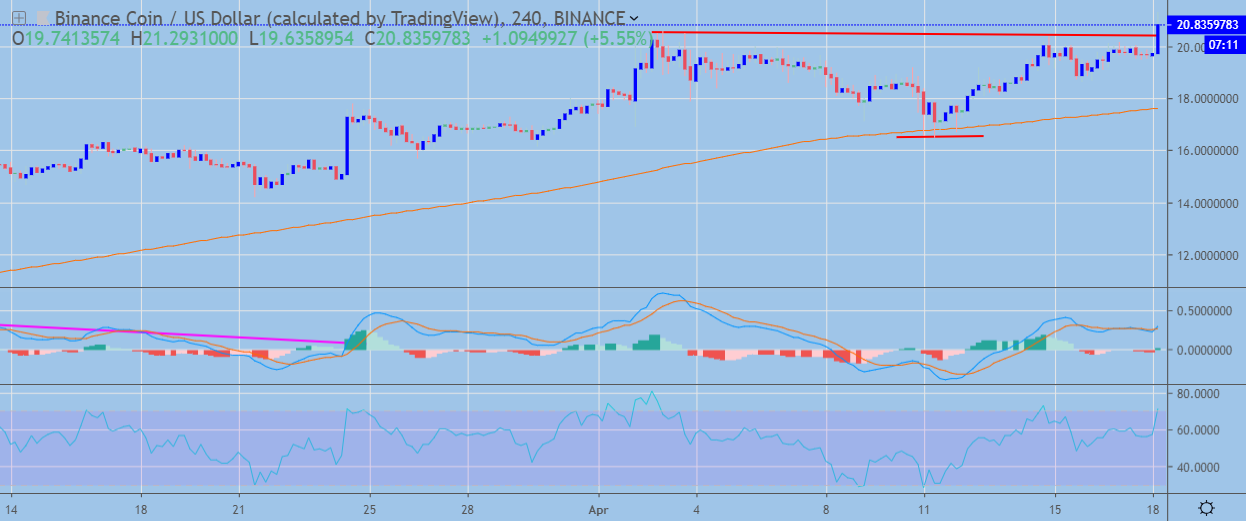 BNB / USD H4 Chart by TradingView
Pattern Watch
Traders should note that the BNB / USD pair could add more than twenty percent to its value if the bullish inverted head and shoulders pattern on the four-hour time frame reaches its full upside potential.
Relative Strength Index
The RSI Indicator is also bullish on the four-hour time frame and shows growing buying interest for the BNB / USD pair.
MACD Indicator
The MACD indicator on the four-hour time frame is bullish and shows scope for further near-term upside.
Fundamental Analysis
The BNB spike was attributed to the announcement made on Binance Twitter account: “Today marks the birth of a new genesis block.” There were no other comments, but it looks like Binance is getting ready to launch the mainnet of Binance Chain.
Binance Coin / USD Medium-term price analysis
Binance Coin has a bullish medium-term outlook, with the cryptocurrency increasingly likely to test towards its all-time price high, which was set during the start of 2018.
The daily time frame also shows that a bullish breakout is in play above the neckline of an inverted head and shoulders pattern, with an even larger upside projection.
Technical indicators are bullish on the daily time frame, although bearish MACD price divergence is still visible from earlier this year.
 BNB / USD Daily Chart by TradingView
Pattern Watch
Traders should note that the upside target of large inverted head and shoulders pattern on the daily time frame would add over seventy percent to the value of Binance Coin.
Relative Strength Index
The RSI indicator is bullish on the daily time frame, although it has yet to make a new monthly high.
MACD Indicator
The MACD indicator on the daily time frame time is conflicted, with the MACD signal line turning lower while the MACD histogram recovers higher.
Fundamental Analysis
In the medium-term, the coin has good prospects. With the launch of Binance Chain, dozens of projects could start migrating from Ethereum to Binance Chain, which should increase the adoption and therefore demand for BNB. In addition to this, Binance will continue to have IEO’s on the Launchpad platform, which will further stimulate buyers to hold the coin.
Conclusion
Binance Coin is attempting another major technical breakout to the upside, with the bullish pattern on the four-hour time frame suggesting that the BNB / USD pair could soon test towards its all-time price high.
The daily time frame is also showing that the cryptocurrency has the potential to trade well beyond its current all-time high, if the pattern reaches its bullish target.
For a quick introduction to the Binance Exchange token, check out our coin guide.
A deeper analysis and overview of the project and its token is available in our latest DARE.