
Shutterstock image by Dim Dimich
Bitcoin Dip Causes $6.5 Billion in Liquidations as Analysts Consider Local Top
Monday trading turns into a blood bath, causing massive crypto price fluctuations.
Bitcoin’s roller-coaster ride took a downturn Monday as BTC dropped 18% to lows of $46,700 on Coinbase, causing rampant liquidations across derivatives markets.
The Bitcoin Top Debate
An $11,000 massive correction drove Bitcoin below $46,700 on Coinbase.
Between 9 and 10 am this morning, $2.37 billion margin positions got liquidated throughout the crypto markets. The total liquidation in the last 24-hours amount is $4 billion, and the crypto market has recorded over $6.5 billion in liquidations since an all-time high of $57,000 reached on Saturday.
The bottom was different across crypto exchanges. European exchange Bitstamp crashed during the drop, and the last recorded low on the exchange is $47,400.
On Bitmex, the low was $47,500 as well, while Kraken revealed a significant lack of liquidity with a drop to $45,000 BTC.
U.S. Treasury Secretary’s comment acted as the perfect catalyst for the sudden plunge. Yellen deemed Bitcoin inefficient and raised illicit financing concerns yet again.
*YELLEN: BITCOIN OFTEN USED FOR ILLICIT FINANCE; IS INEFFICIENT
— *Walter Bloomberg (@DeItaone) February 22, 2021
On Tuesday, Bitcoin broke above $50,000 for the first time and hit an ATH on Saturday. Ethereum also broke above $2,000 for the first time on Feb. 20.
A comparatively smaller drop late on Saturday caused $2.5 billion in liquidations. Bitcoin touched lows of $54,000 that day, while ETH to $1810.
Quick recovery to opening prices may indicate that buyers quickly bought the dip, but the price action is also a textbook top indicator.
Last Chance to Sell Bitcoin?
The price charts of all cryptocurrencies, especially altcoins, paints a painful picture for traders. The drastic drop hunted crypto long-orders and caused liquidations worth $2.37 billion.
The wick or shadow marks the top and bottom in the stipulated time period, representing the price fluctuations relative to its opening and closing price.
A longer wick indicates a large fluctuation in the asset price. This morning most cryptocurrencies painted a classic “hanging man.” A hanging man candlestick in an uptrend represents heavy selling, which may mark the asset’s local top.
That is one nasty hanging man.https://t.co/oEyOwozEq3 pic.twitter.com/YHvy15AboZ
— Mati Greenspan (@MatiGreenspan) February 22, 2021
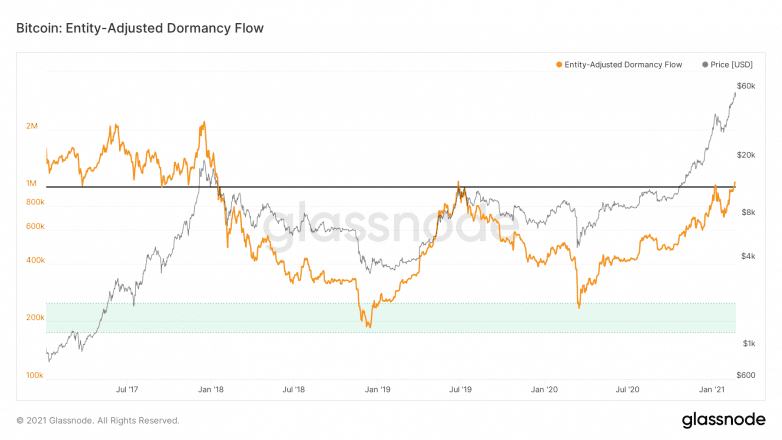
The dormancy flow metric, which measures the flow of ‘HODLer’ tokens relative to the on-chain volume, has entered the overbought region as well. In 2019, the dormancy flow marked the top around $14,000, while in 2017, the ratio was over-extended for most of the year.
If the flow continues to increase, with buyers failing to keep up the price, Bitcoin could drop further to retest the previous high of $42,000.
The struggle between the bulls and bears in the next couple of weeks will be instrumental in setting the mid to long-term price as BTC reaches a crucial point.
Disclosure: The author held Bitcoin at the time of press.