
Bitcoin, Ethereum to Regain Lost Ground as Investors Buy the Dip
The top two cryptocurrencies by market capitalization could be preparing for a short-lived rebound as buying pressure slowly builds up.
Roughly $2 billion in long positions have been liquidated during the most recent correction in the cryptocurrency market. On-chain analysis now shows that investors may not have to wait long to make up their losses.
Both Bitcoin and Ethereum are already showing signs of a potential rebound.
Bitcoin Consolidates Before Next Major Move
The flagship cryptocurrency took a 17% nosedive after rising to a new yearly high of nearly $19,500 on Nov. 25. Since then, prices have been consolidating within a narrow trading range without providing a clear path for where they are headed next.
The lackluster price action seen in the past few days forced the Bollinger bands to squeeze on the 1-hour chart, indicating that a major price movement is underway.
Some of the most prominent technical analysts in the industry view squeezes as stagnation periods that are usually succeeded by high volatility.
The longer the squeeze, the more violent the breakout that follows.
Given the lack of direction for Bitcoin’s trend, the area between the lower and upper bands can be considered a reasonable no-trade zone. Only a candlestick close above or below any of these critical hurdles will determine whether or not the pioneer cryptocurrency is poised to recover lost ground.
Slicing through the overhead resistance at $17,420 would likely be followed by a spike in buy orders behind Bitcoin. The potential increase in demand could have the strength to push prices back above $18,000.
As a matter of fact, one of the most significant resistance barriers ahead of BTC sits at $18,350.
Conversely, if sell orders begin to pile up around the current price levels, Bitcoin might break below the underlying support at $16,500.
Turning this demand wall level into resistance will likely result in further losses.
A downswing below this price point may trigger panic selling among investors, pushing prices down to $15,350 or even $13,500.
Ethereum to Rebound But Faces Stiff Resistance
The $475 resistance level has capped Ethereum’s price action since early September.
But on Nov. 20, the buying pressure behind Ether was significant enough to allow it to finally break through this hurdle and rise more than 30%, pushing prices to a new yearly high of $620.
From a technical perspective, the upswing was correlated with the breakout of an ascending triangle developed on ETH’s 1-day chart for the last three months. A horizontal resistance wall formed along with the swing-highs, while a rising trendline was created along with the swing-lows.
The distance between the widest point of the triangle projected a target of $730.
Now that Ethereum retested the breakout point at $475, it could be poised for another leg up to reach the triangle’s target.
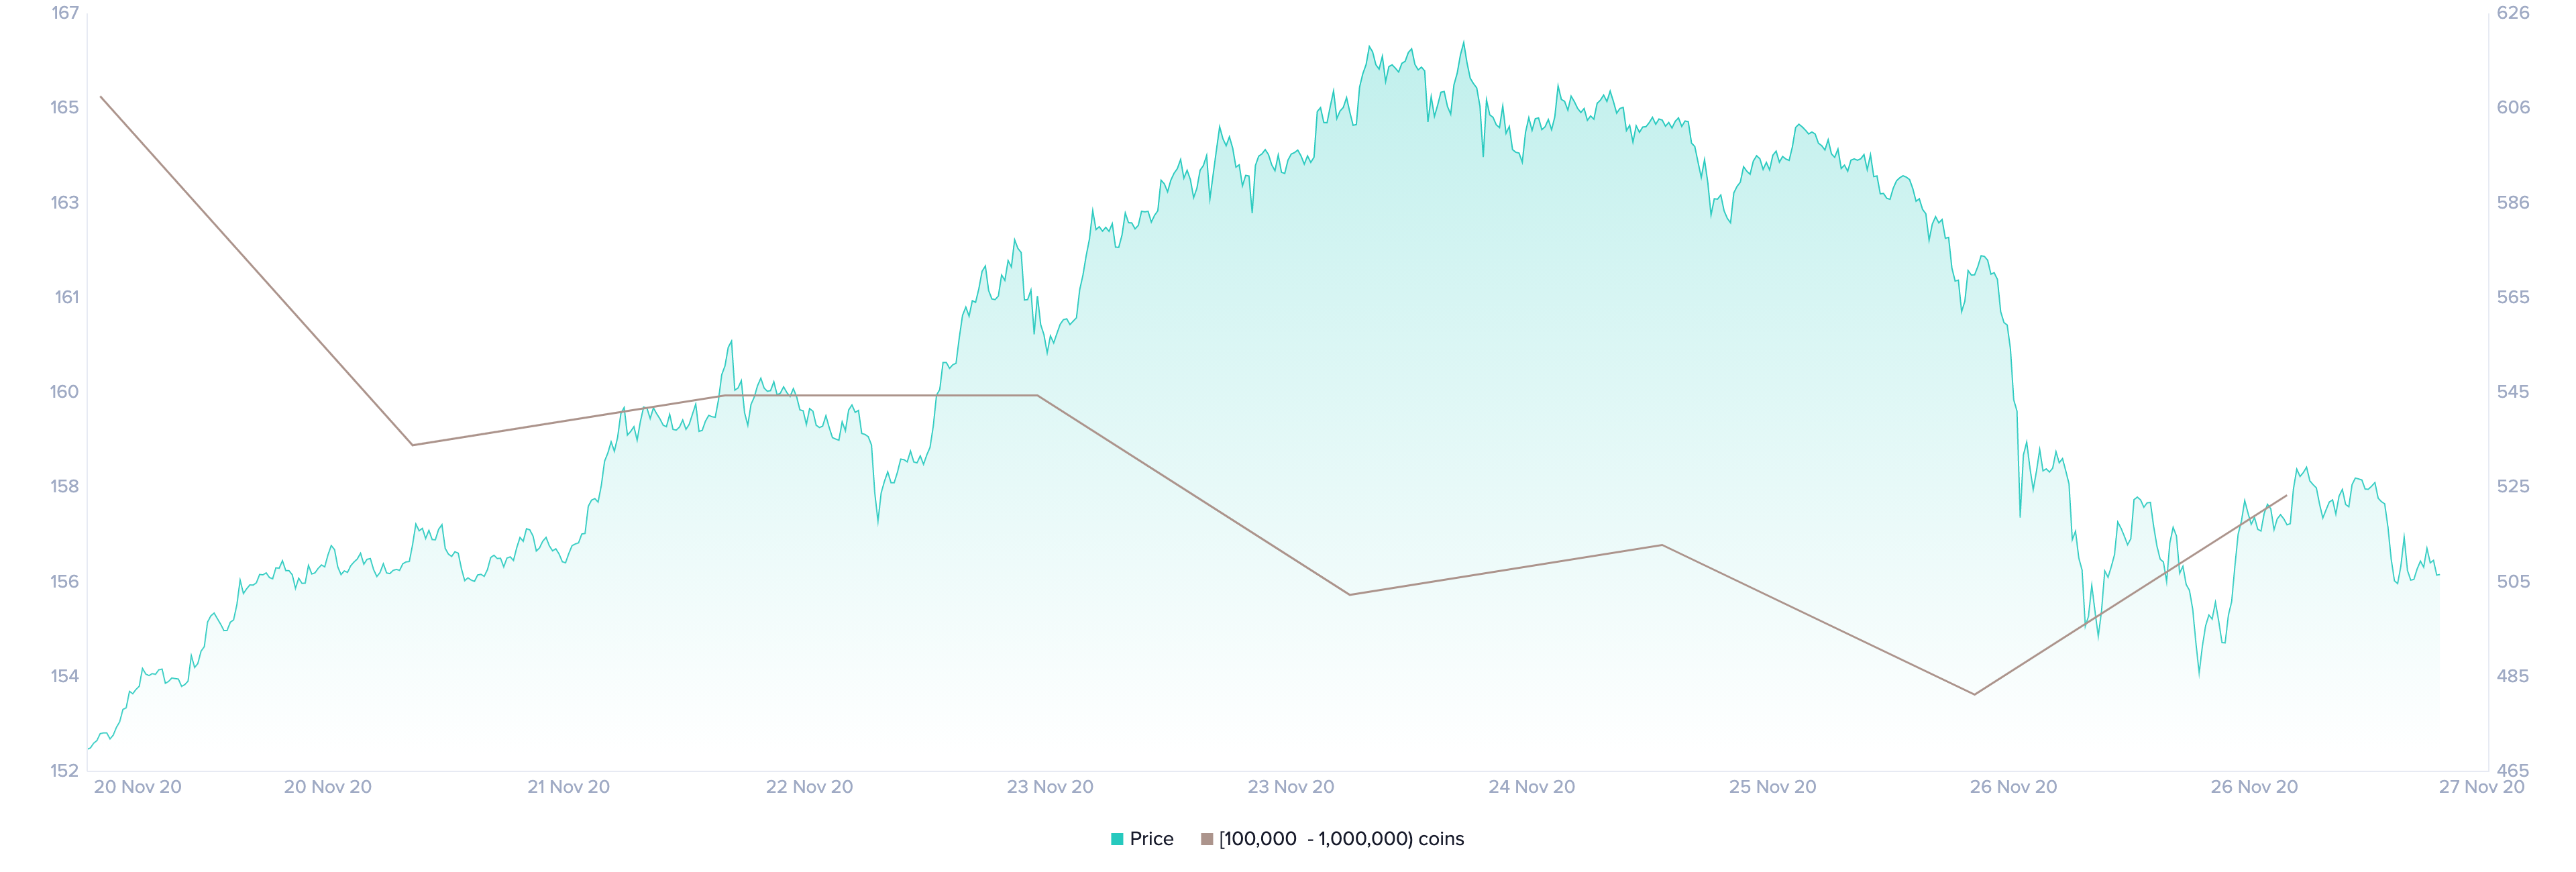
Such a bullish thesis holds when looking at Santiment’s holder distribution chart.
The behavioral analytics firm recorded a spike in buying pressure as prices were collapsing. This market behavior indicates that some investors took advantage of the downward price action to “buy the dip.”
Indeed, the number of addresses holding 100,000 to 1 million ETH shot up in the past 24 hours. Roughly four new whales also joined the network, representing a 2.6% increase in a short period.
When considering that these large investors hold between $51 million and $510 million in Ether, the sudden spike in buying pressure can translate into millions of dollars.
Ethereum may thus have the ability to rebound towards higher highs if whales continue loading up.
Regardless of the bullish outlook, IntoTheBlock’s “In/Out of the Money Around Price” (IOMAP) model reveals a major supply barrier that may prevent the second-largest cryptocurrency by market cap from achieving its upside potential.
Based on this on-chain metric, the area between $523 and $570 is filled by more than 1 million addresses that had previously purchased over 13 million ETH. Such a massive supply wall has the ability to absorb some of the buying pressure seen recently.
But if Ethereum can slice through this hurdle, it would likely climb towards $730.
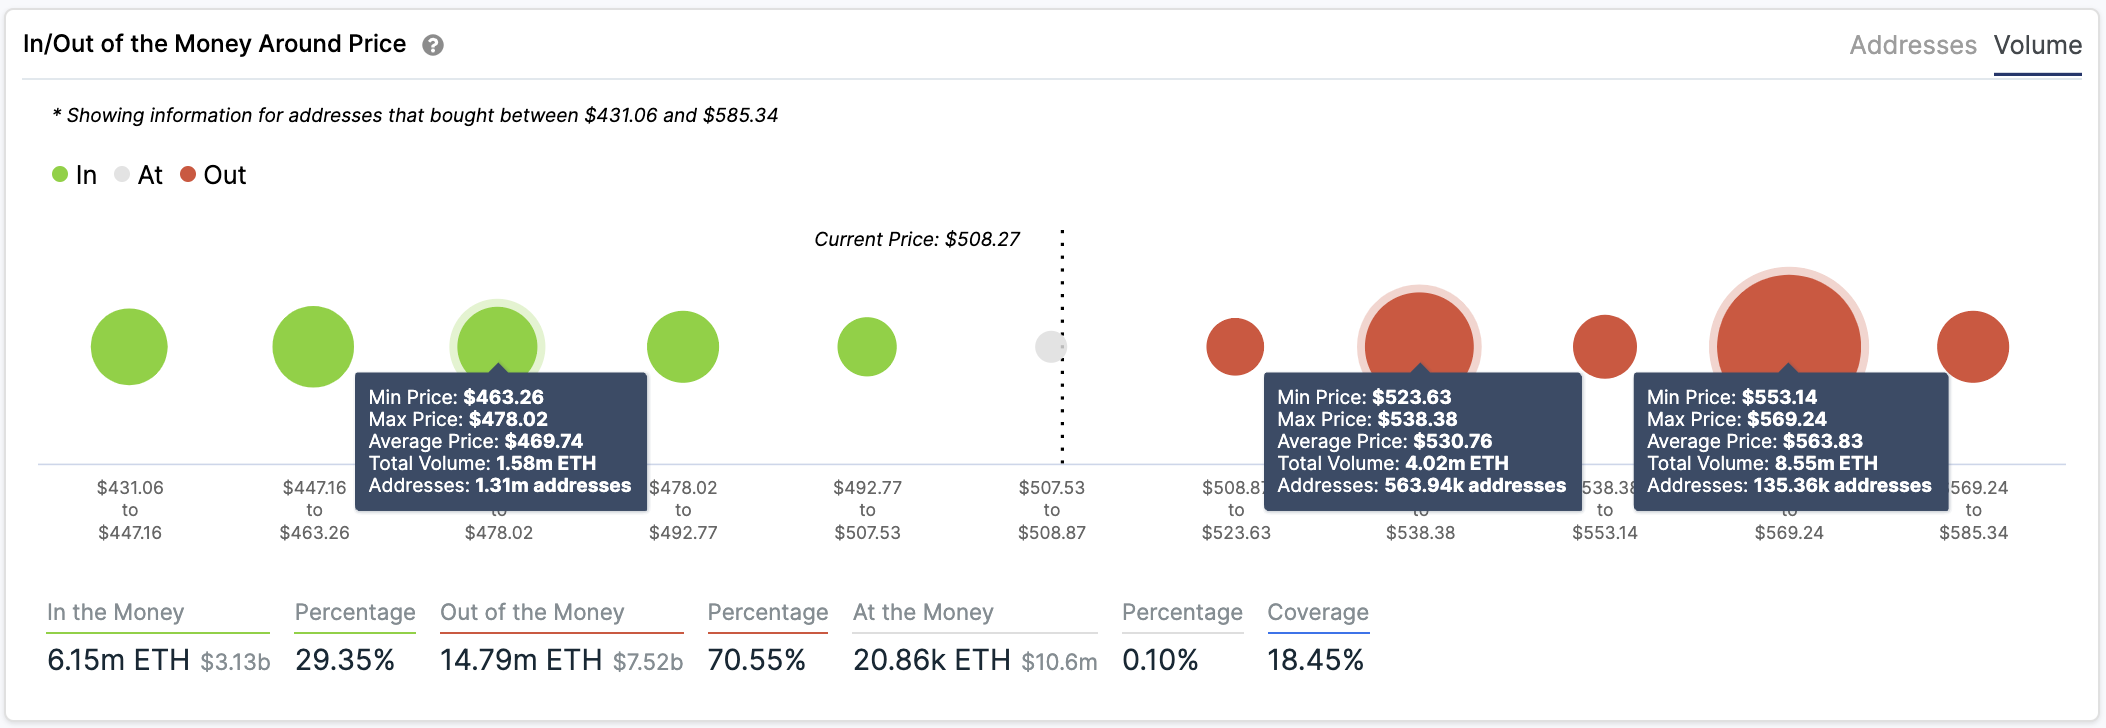
On the flip side, the IOMAP cohorts show that the $475 support level may not be able to contain another sell-off.
Only 1.3 million addresses bought roughly 1.6 million ETH around this price level, making it weak support compared to the overhead resistance.
Slicing through this hurdle will likely jeopardize the optimistic scenario and lead to further losses.
Investors Prepare to “Buy the Dip”
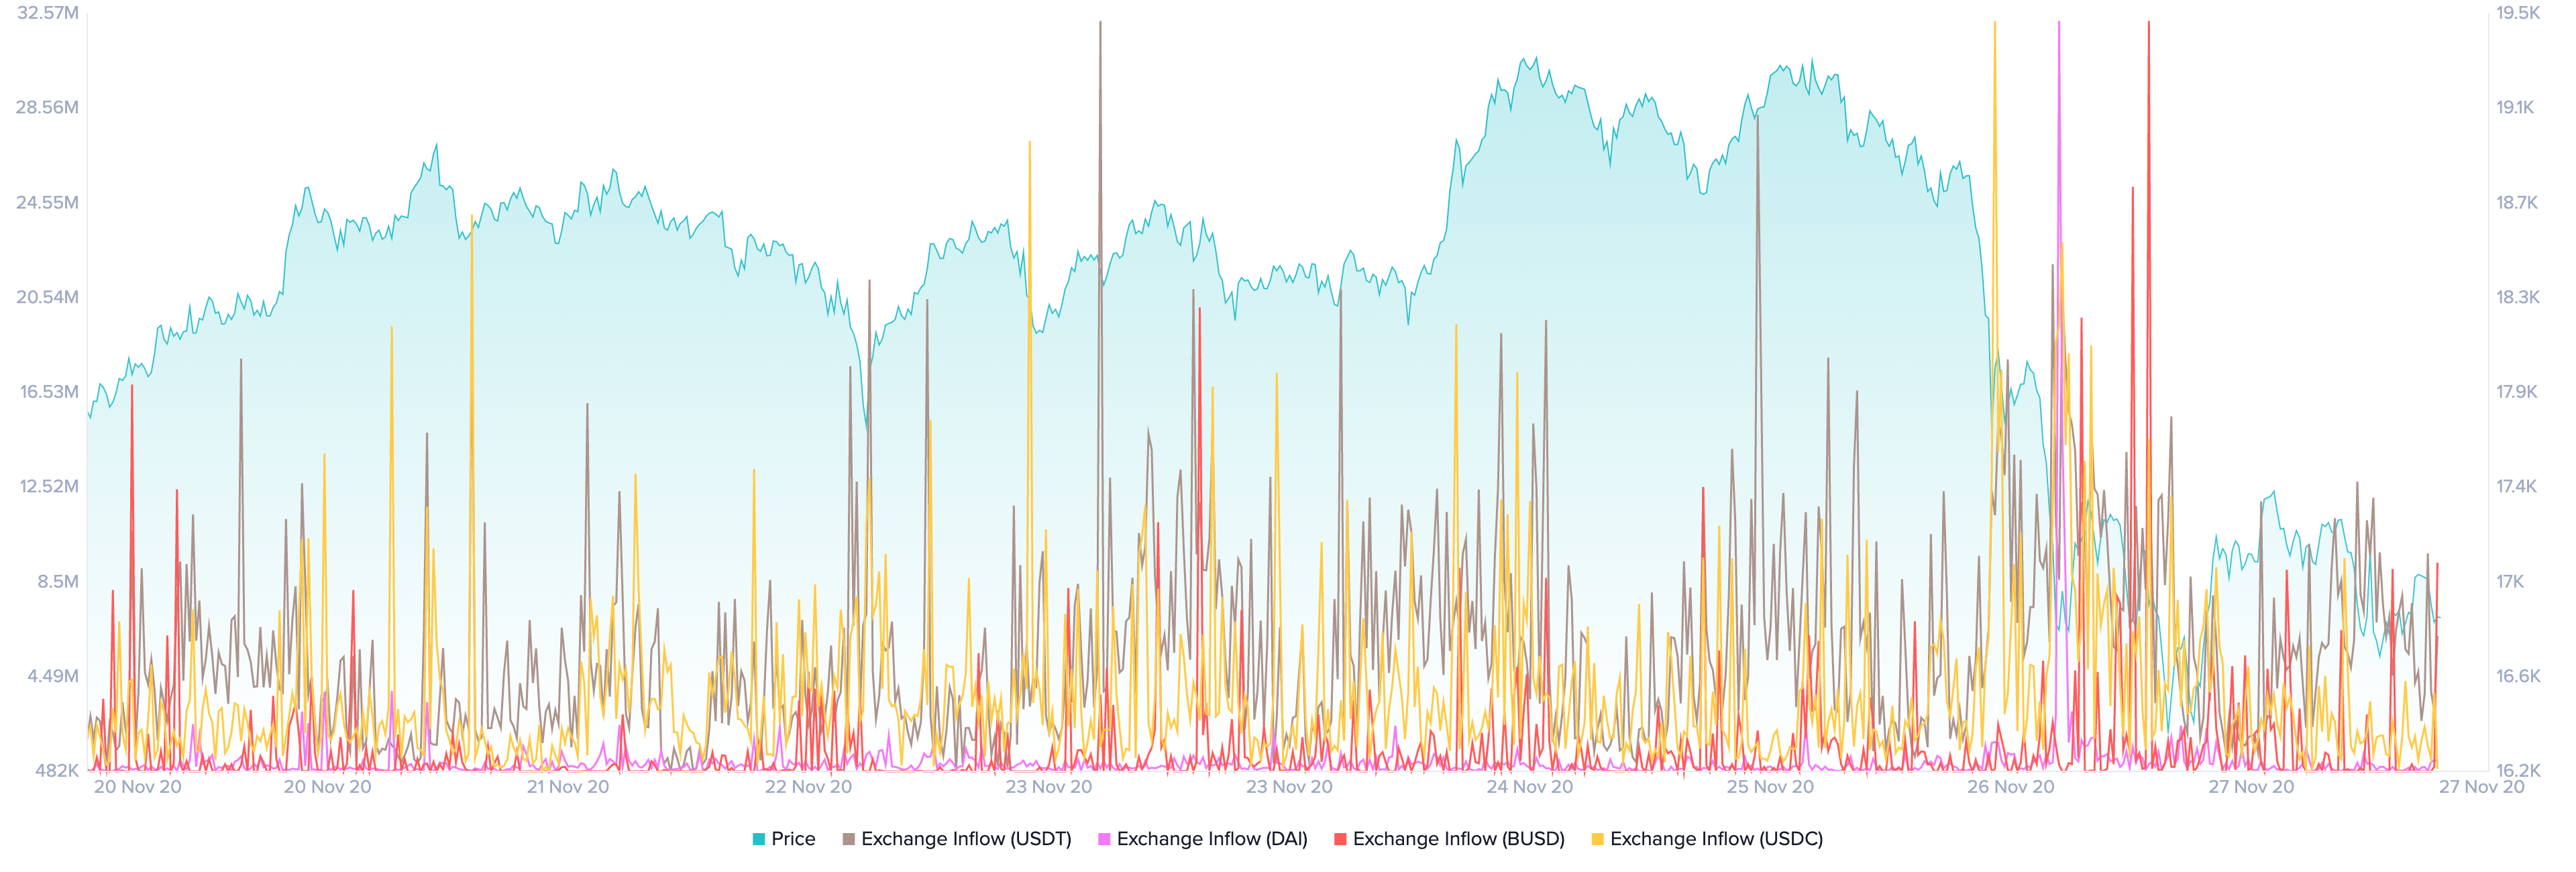
On-chain data shows a close relationship between the exchange inflow of stablecoins and Bitcoin’s price action. Numerous times throughout the past year, a spike in the number of stablecoins transferred to known exchange wallets was followed by a bullish impulse.
Dino Ibisbegovic, content and SEO manager at Santiment, maintains that when stablecoins begin to flood exchanges, it is indicative of an increase in “buy the dip” sentiment.
“I reported on this phenomenon back in May following Bitcoin’s +10% pump, and once again earlier this month, on the back of BTC’s +16.9% week. In both cases, I noted that Bitcoin’s bounceback seems to occur when stablecoin whales and/or retail owners start offloading their stablecoin bags – and especially if there’s a corresponding spike in the inflow of stablecoins to exchanges,” said Ibisbegovic.
Recently, Santiment recorded a major uptick in the number of stablecoins sent to known exchange wallets during the correction.
More than 720 million USDT, 230 million DAI, 85 million BUSD, and 317 million USDC were transferred to exchanges.
Given the recent market behavior, it is very likely that sidelined investors are taking advantage of the low prices to re-enter the market.
For this reason, it is imperative to pay close attention to the support and resistance levels previously mentioned.
If Bitcoin and Ethereum manage to break their respective resistance barriers, a further advance will be almost guaranteed.