
Bitcoin, Ethereum, and XRP Back in the Green
The top three cryptos by market cap are posting gains after a long period of consolidation. Even though there is significant resistance ahead, the bullish outlook still is quite promising.
Bitcoin, Ethereum, and XRP surged in the last few hours, making a rebound alongside the stock market as COVID-19 pandemonium cools. It seems that the crypto market is ready for a further advance.
Bitcoin Bounces Off Support
Bitcoin is up more than 7.5% in the past 12 hours. The sudden bullish impulse allowed it to regain the $7,000 level as support. Now, the flagship cryptocurrency could be heading to $9,000 or higher, if the bulls step in.
Considering that on Apr. 6 Bitcoin broke out of an ascending triangle, the bullish outlook seems extremely likely. This technical formation is defined as a continuation pattern that projects a 34% target to the upside upon the breakout point.
Since the pioneer cryptocurrency recently pulled back for a retest of the breakout point, it could now be preparing to resume the uptrend and reach higher highs.
Nonetheless, the TD sequential indicator is currently presenting a sell signal in the form of a green nine candlestick on BTC’s 3-day chart. This index estimates that Bitcoin could go through a one to four candlesticks correction. If validated, the bellwether cryptocurrency would likely drop to the setup trendline that sits around $5,600.
Due to the ambiguous outlook that Bitcoin presents, the Fibonacci retracement indicator can be used to determine the direction of the trend.
Breaking above the Apr. 7 high of nearly $7,500, for instance, may trigger a stage of FOMO (fear-of-missing-out) among investors due to the proximity of the halving. Such a bullish impulse could have the potential to push BTC up to the target given by the ascending triangle, as previously mentioned.
Conversely, if the strength of the 23.6% Fibonacci retracement level weakens and fails to hold, the odds for the bearish outlook will increase. Under this premise, Bitcoin would likely fall to the next areas of support around the 38.2% and 50% Fibonacci retracement levels.
These demand barriers sit at $6,100 and $5,700, respectively.
Ether Faces Strong Resistance Ahead
Ethereum stole the spotlight in the cryptocurrency sphere after skyrocketing nearly 18% in the last few hours. The smart contract giant surged from a low of $148 to a high of $174.
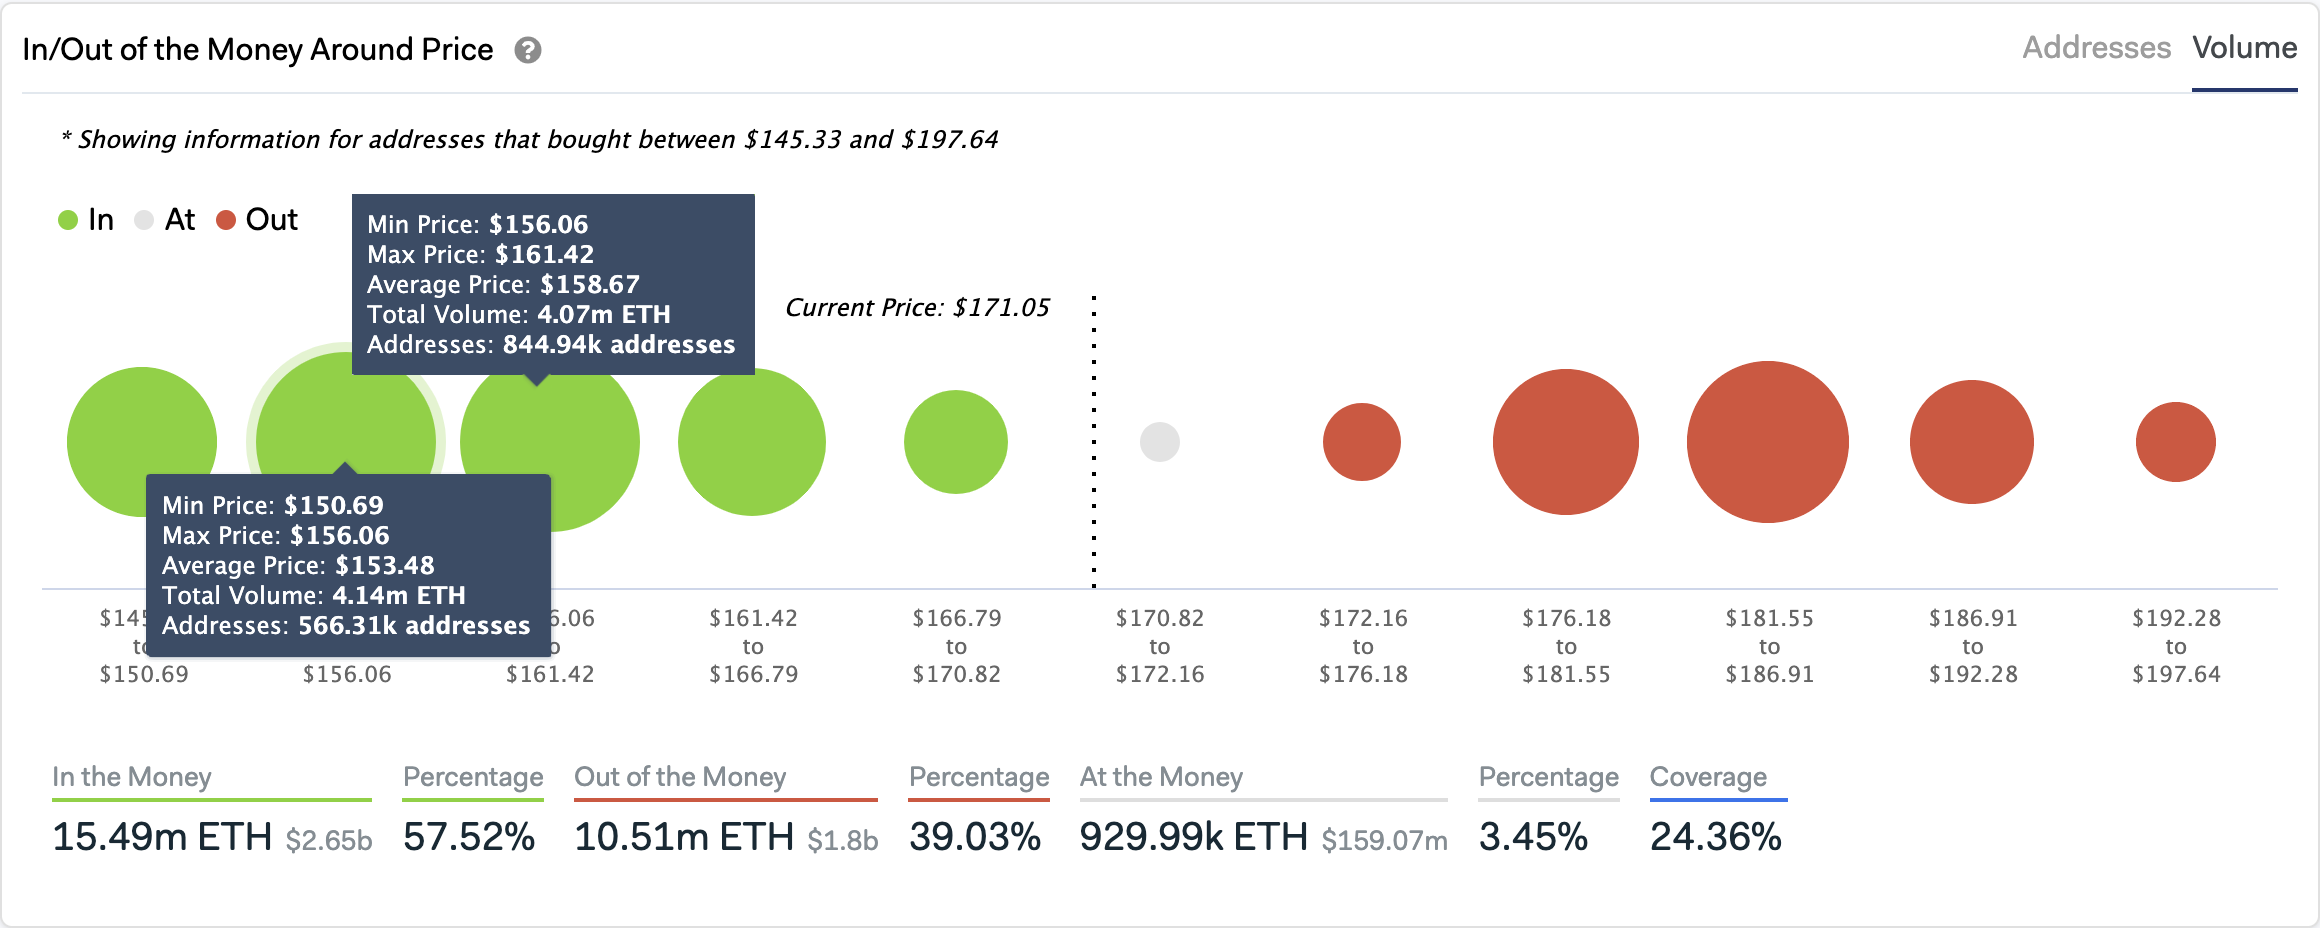
IntoTheBlock’s “In/Out of the Money Around Price” (IOMAP) model reveals that the upswing was triggered by more than 1.4 million addresses that bought over 8 million ETH between $150 and $161. This significant number of addresses appear to have bought the “dip,” expecting a further advance in Ether’s price.
While long Ether positions continue reaching new all-time highs in Hong Kong-based cryptocurrency exchange Bitfinex, Ethereum is facing strong resistance ahead. Indeed, the 200-day moving average appears to be containing the second largest cryptocurrency by market cap from a further bullish impulse.
It is worth mentioning that this is the second time Ether is trying to break above this hurdle since the Mar. 12 crash. Thus, its strength is weakening, which adds credence to the optimistic outlook.
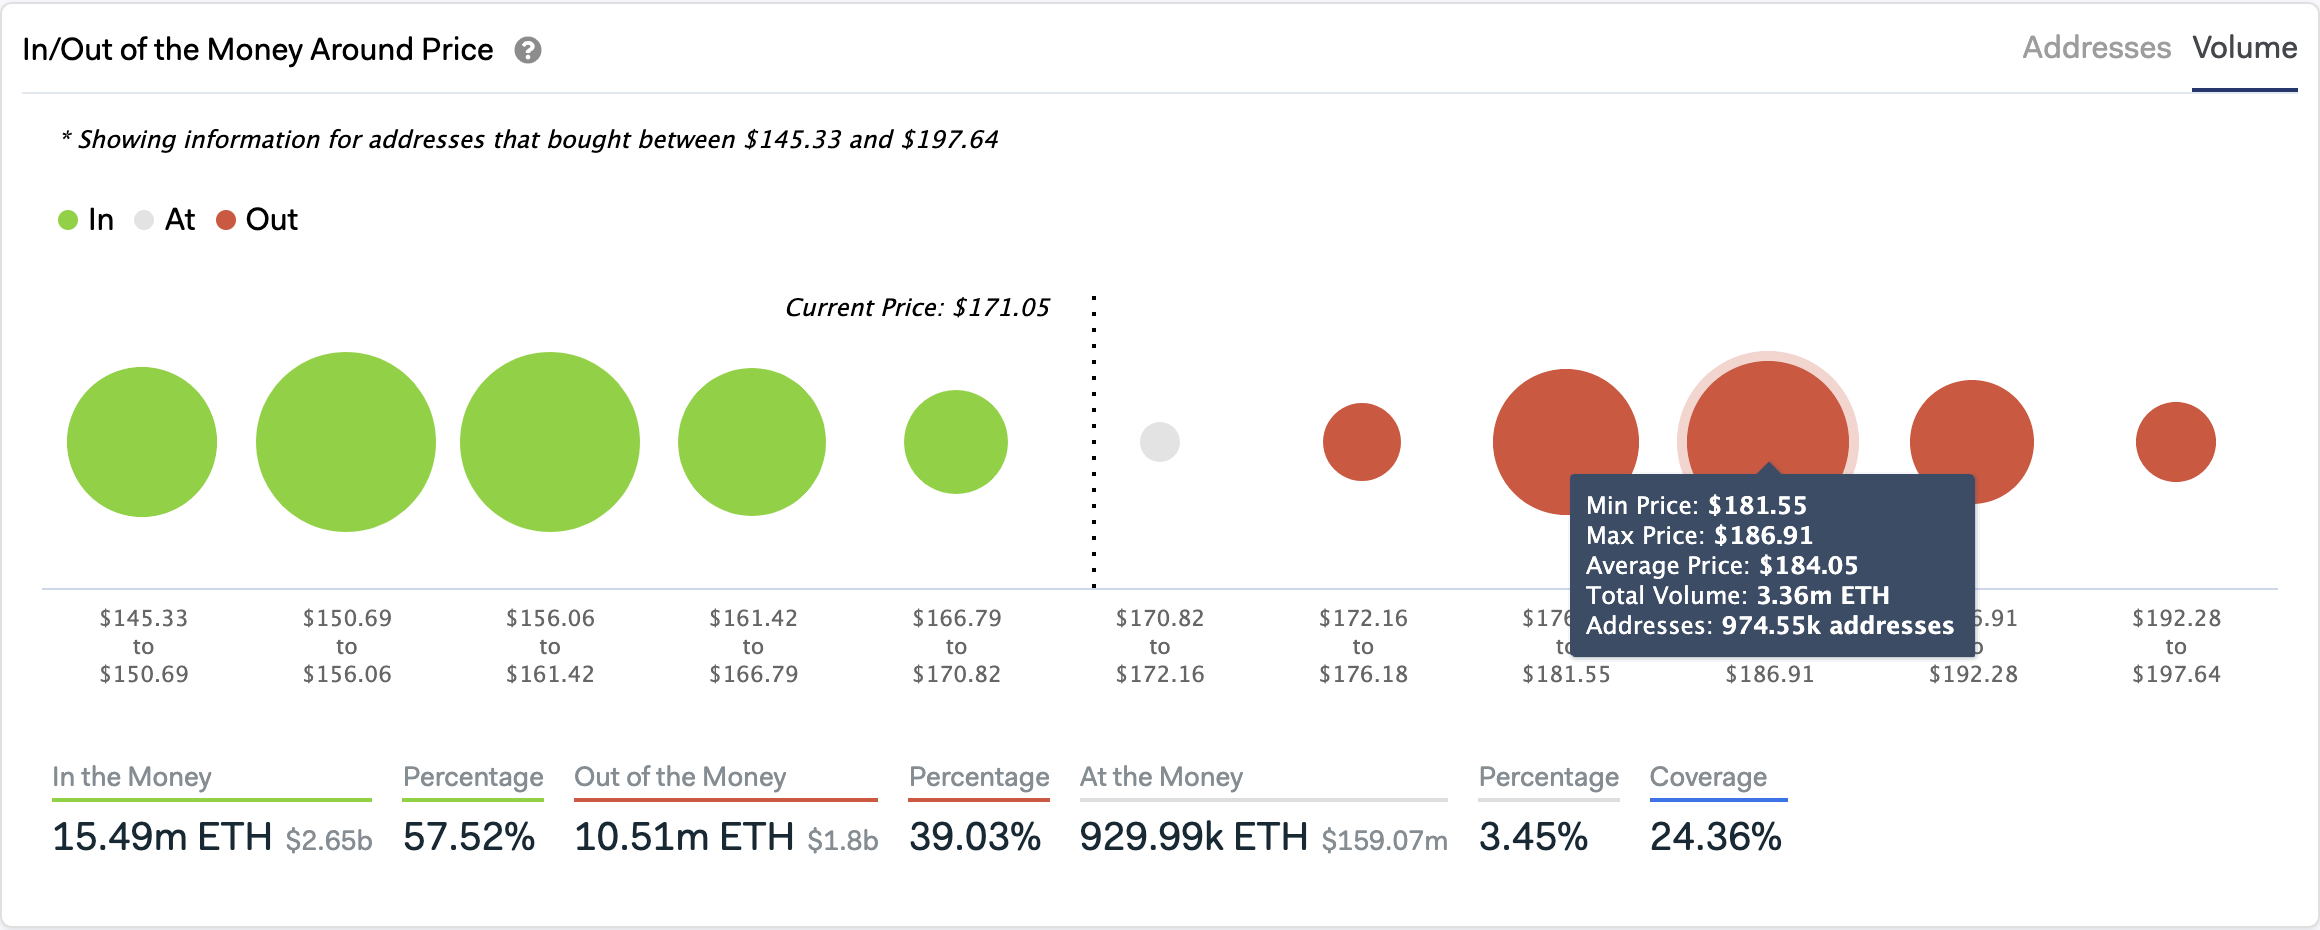
An increase in demand around the current price levels could allow Ether to break its 200-day moving average. If this were to happen, the IOMAP estimates that the next significant supply barrier sits between $182 and $187. This is where nearly 1 million addresses are holding 3.36 million ETH.
Even though the bullish outlook seems promising, there is also a probability that the 200-day moving average continues to hold. A rejection from this resistance level could send Ether back to $161 or lower.
Therefore, waiting for confirmation will be key to profit from ETH’s next major price movement.
XRP Struggles to Advance
While most of the top cryptocurrencies by market cap were able to post significant gains during the first quarter of 2020, Ripple’s XRP ended Q1 with a negative return of 10%. The cross-border remittances coin got slashed by 70% during Black Thursday, as its price dropped to levels not seen since May 2017.
From a long-term perspective, it seems like the downward movement was predictable because XRP continues making a series of lower lows and lower highs since the January 2018 peak. While this crypto does not close above the Feb. 15 high of $0.35, one could expect another swing low.
In the meantime, XRP is trying to regain its 50-day moving average as support. If it succeeds, it will likely move further up to test its 200-day moving average. This resistance barrier is currently hovering around $0.23.
Failing to turn the 50-day moving average into support will increase the odds for another lower low.
Overall Sentiment
Investors appear to be growing more optimistic as U.S. President Donald Trump affirmed that the biggest economy in the world is preparing to reopen because growth in new coronavirus infections has tapered off.
Now, not only is the stock market showing signs of recovery, but also the cryptocurrency industry. Although the Crypto Fear and Greed Index is still sensing “extreme fear” among market participants, some could be taking advantage of this sentiment to buy Bitcoin on the cheap as the halving approaches.
From a market marker perspective, it seems reasonable to pump prices in the run up to the upcoming block rewards reduction to get as many investors as possible to FOMO-in. Once prices are up, these so-called “whales” would likely dump their holdings, pushing the market back down, profiting from the wild price action.
This type of market manipulation strategy can be across the previous Bitcoin halvings. In the upcoming one, history may repeat itself.