
Shutterstock cover by A_Sh
Bitcoin, Ethereum, and XRP Enter Downtrend With Few Signs of Slowing
The cryptocurrency market continues bleeding as investors hit the panic button.
Bitcoin, Ethereum, and XRP faced a bearish market this week. And while some investors have already bought last weekend’s dip, prices continue to fall without any considerable support ahead.
Bitcoin Holds Above Thin Support
Investors are trying to catch a falling knife. More than $1.25 billion worth of long BTC positions has been liquidated across the board in the past 24 hours.
Despite the blowout, Bitcoin’s drop shows no signs of stopping.
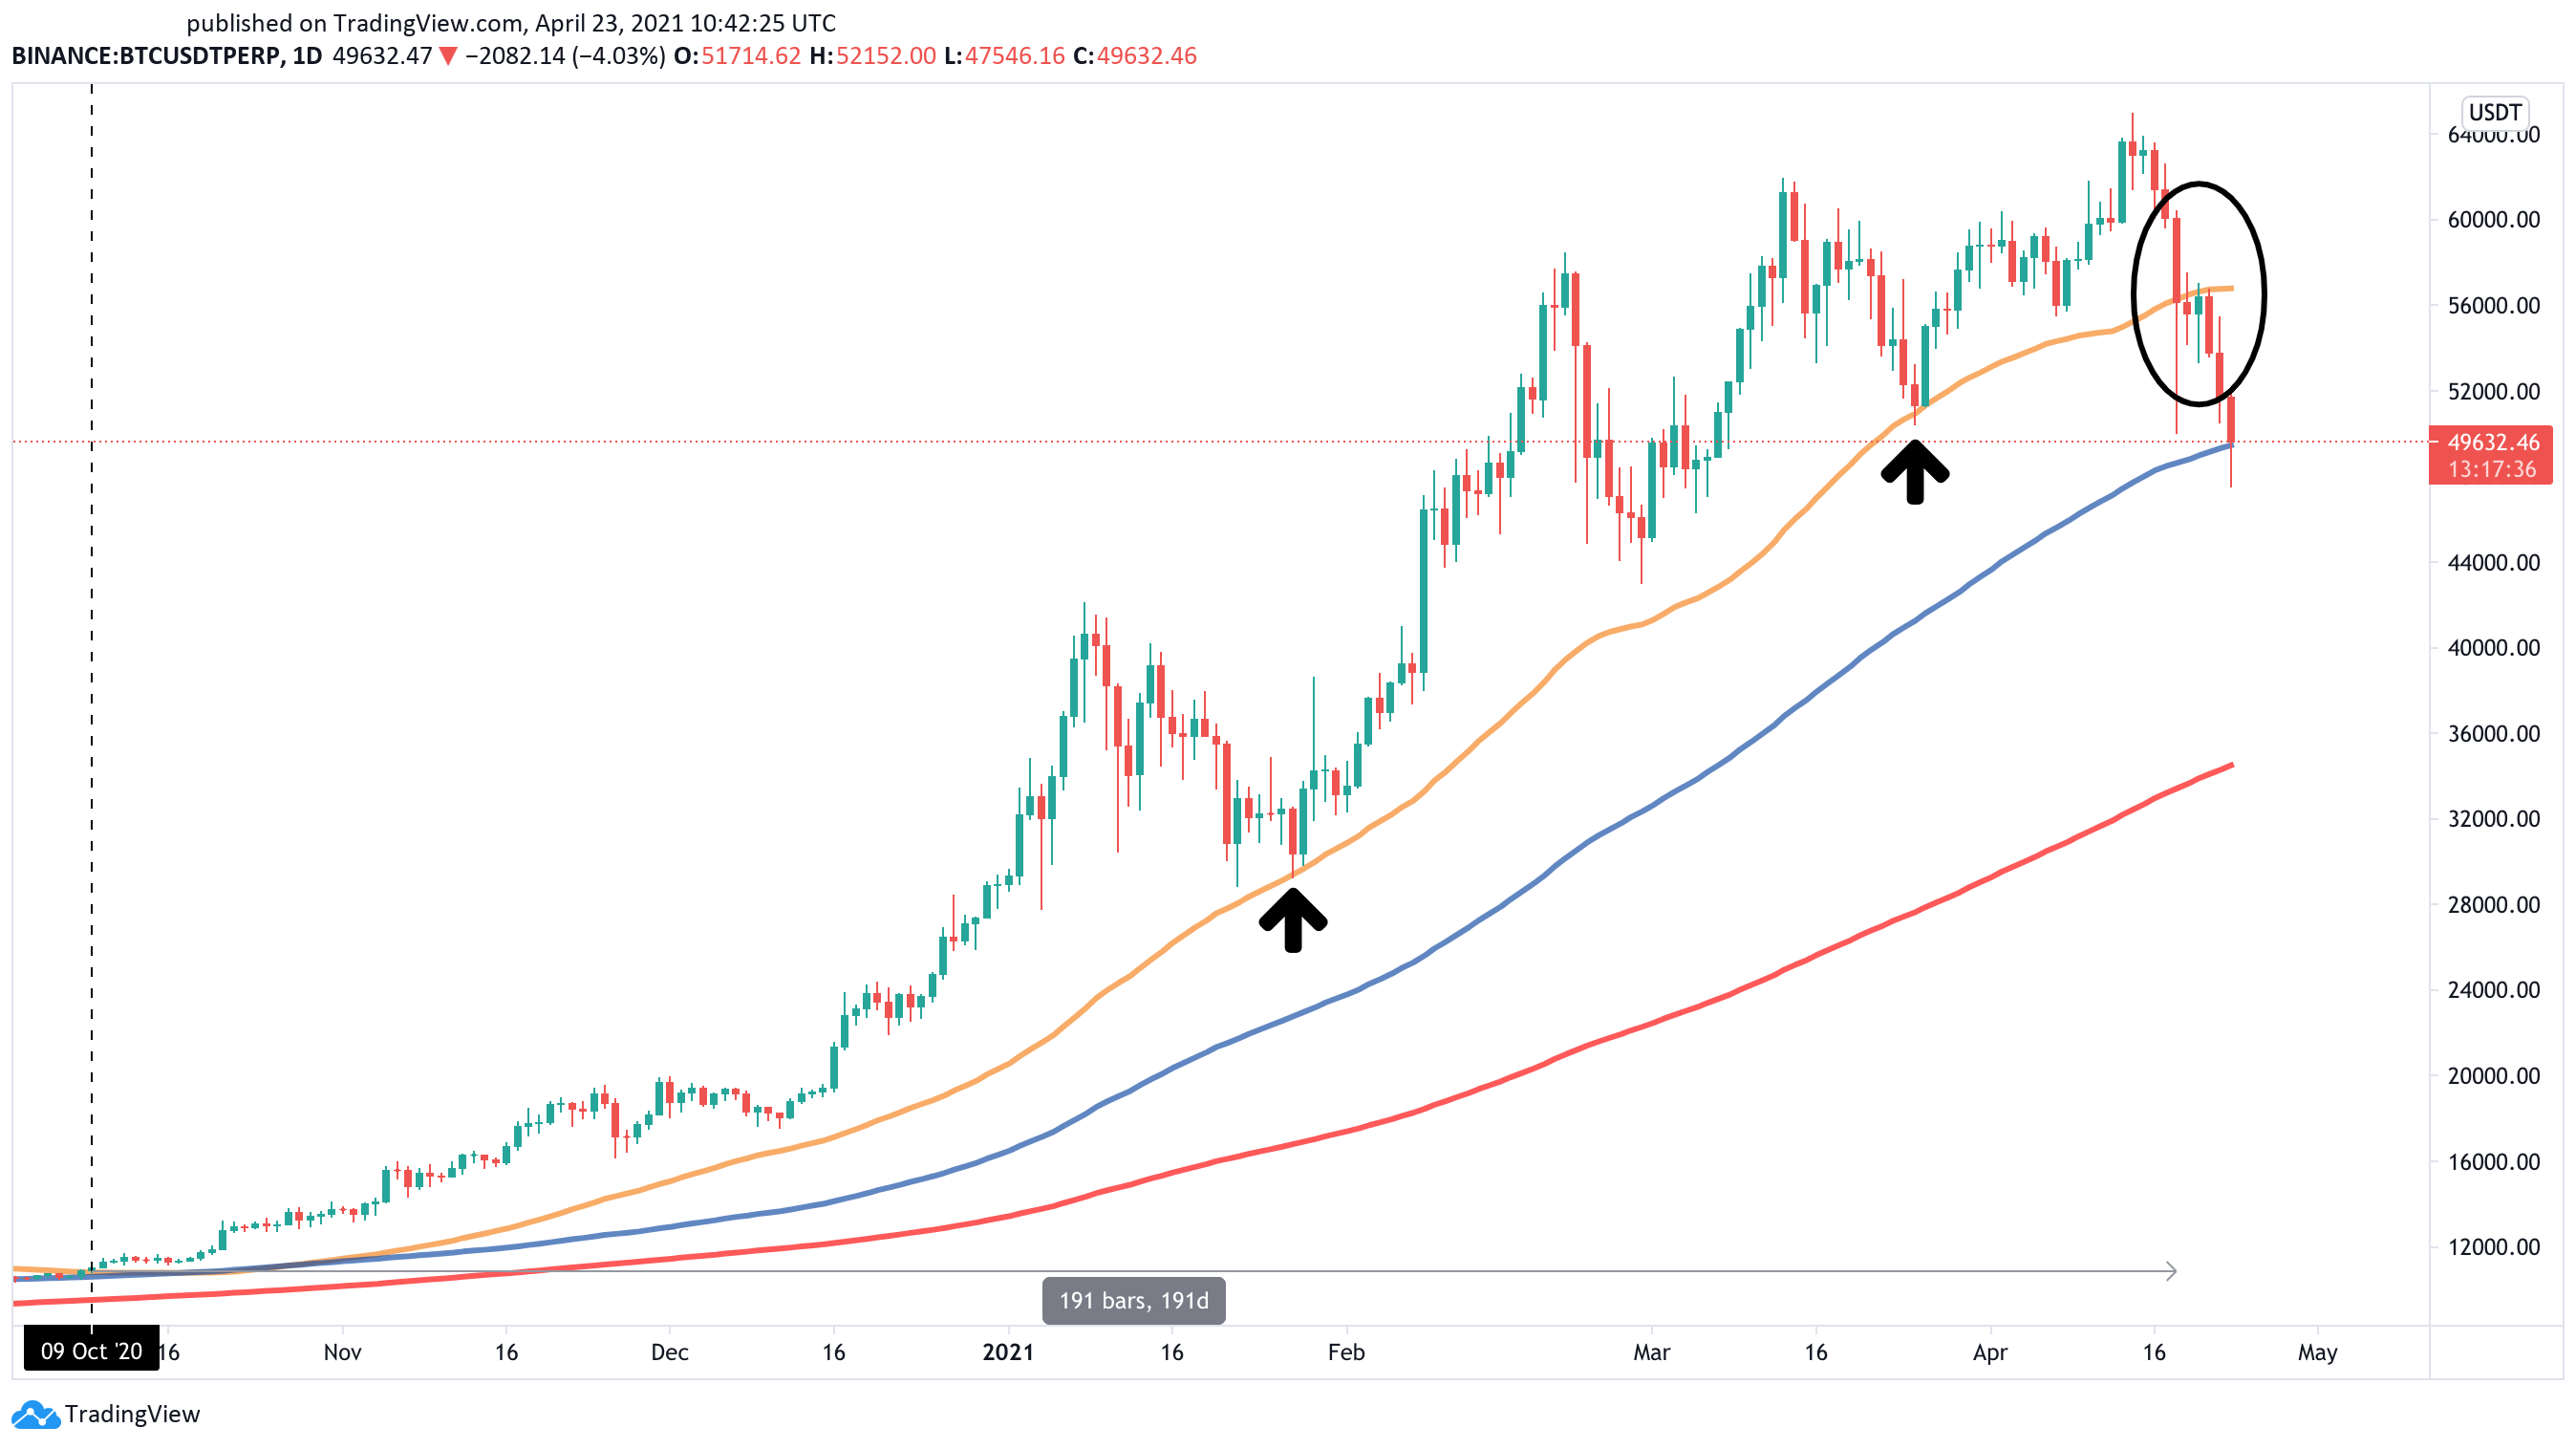
Losing the 50-day moving average as support on Apr. 18 for the first time in seven months marked a turning point for Bitcoin’s uptrend. Since then, the flagship cryptocurrency has dropped another 15.30% and is trying to hold above the 100-day moving average at the time of writing.
Increased downward pressure in the spot markets could be disastrous as the next crucial demand wall is represented by the 200-day moving average at $35,000.
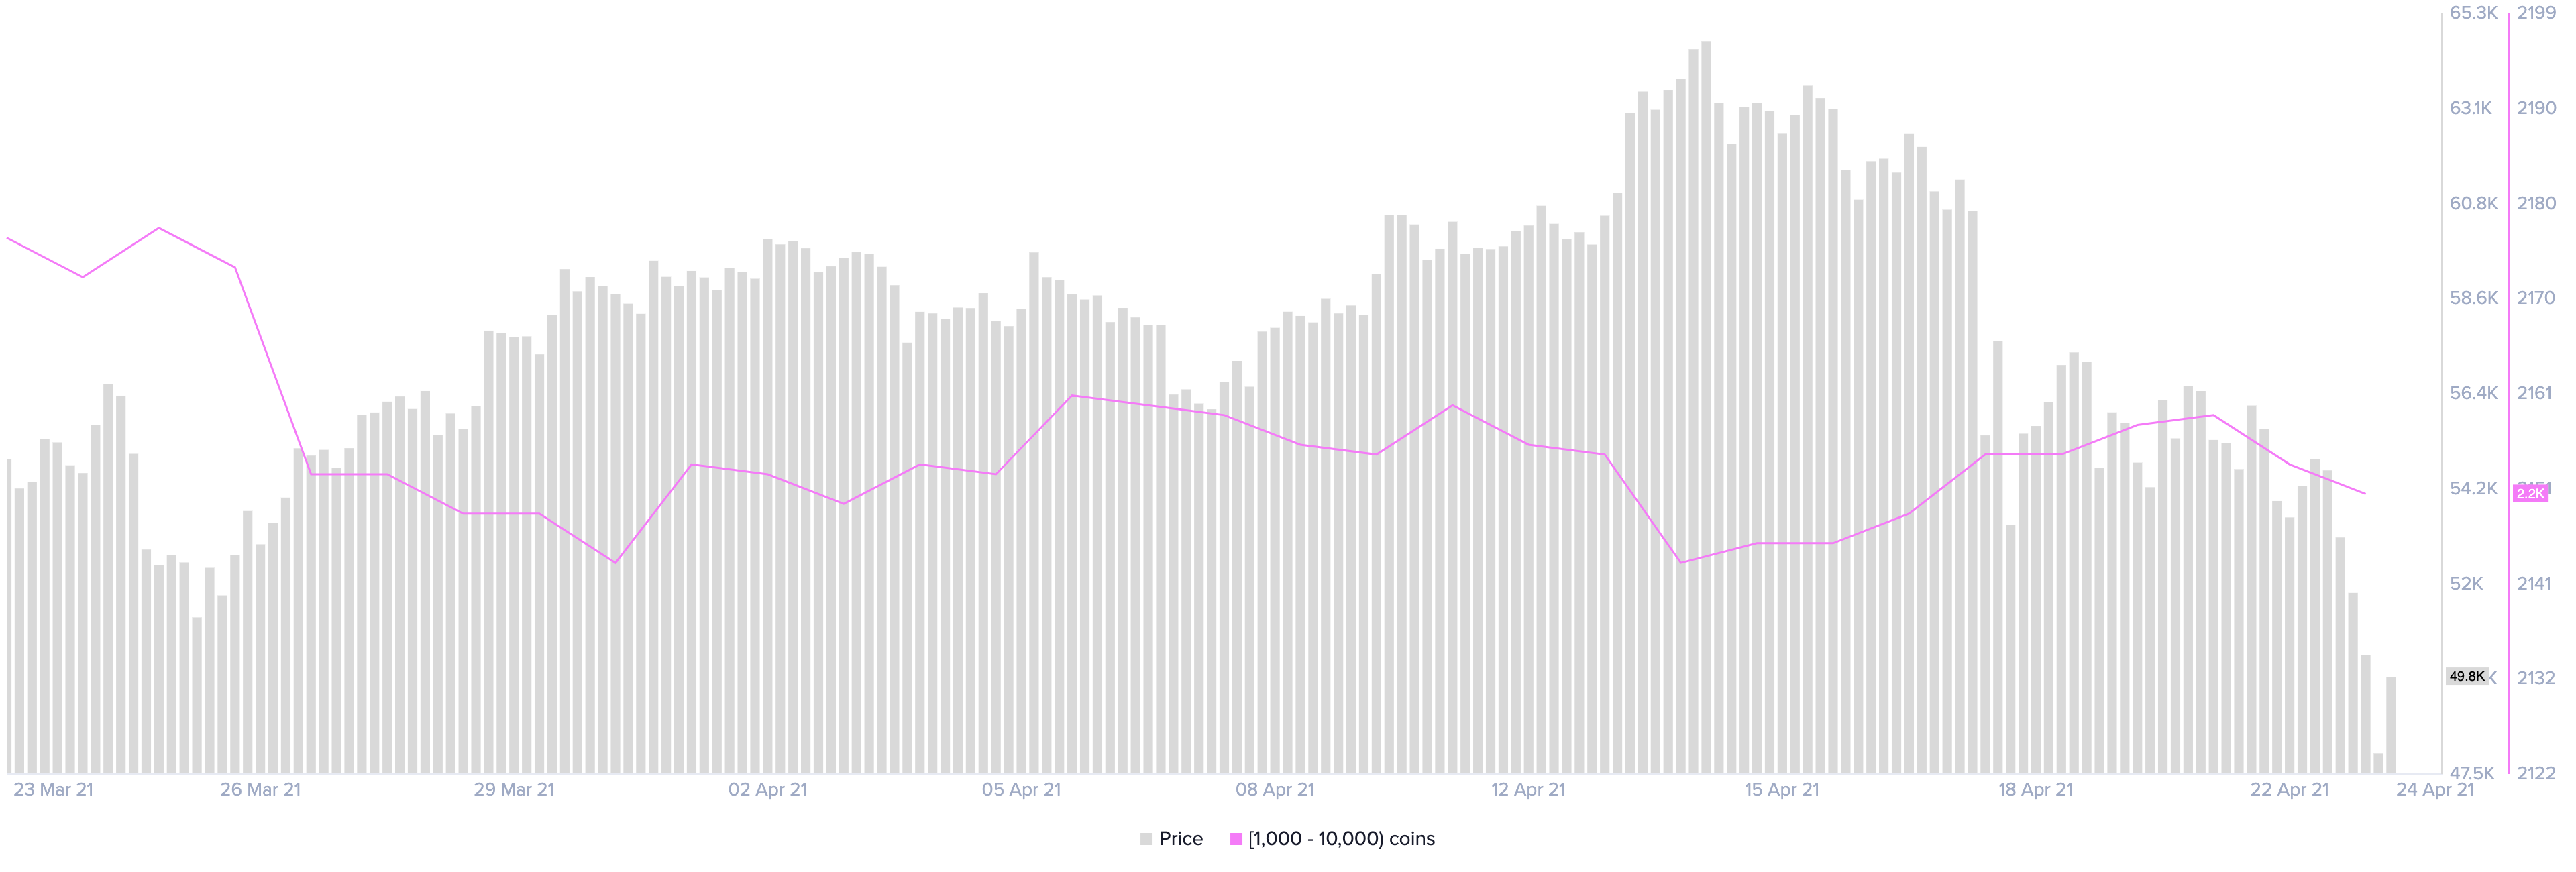
Bitcoin’s supply distribution chart adds credence to the pessimistic outlook. The number of addresses with 1,000 to 10,000 BTC dropped by 0.37% in the past 48 hours. Roughly eight whales have left the network within such a short period.
The recent decline in the number of large investors behind Bitcoin may seem insignificant at first glance. However, when considering these whales hold between $50 million and $500 million in BTC, the sudden spike in selling pressure can translate into millions of dollars.
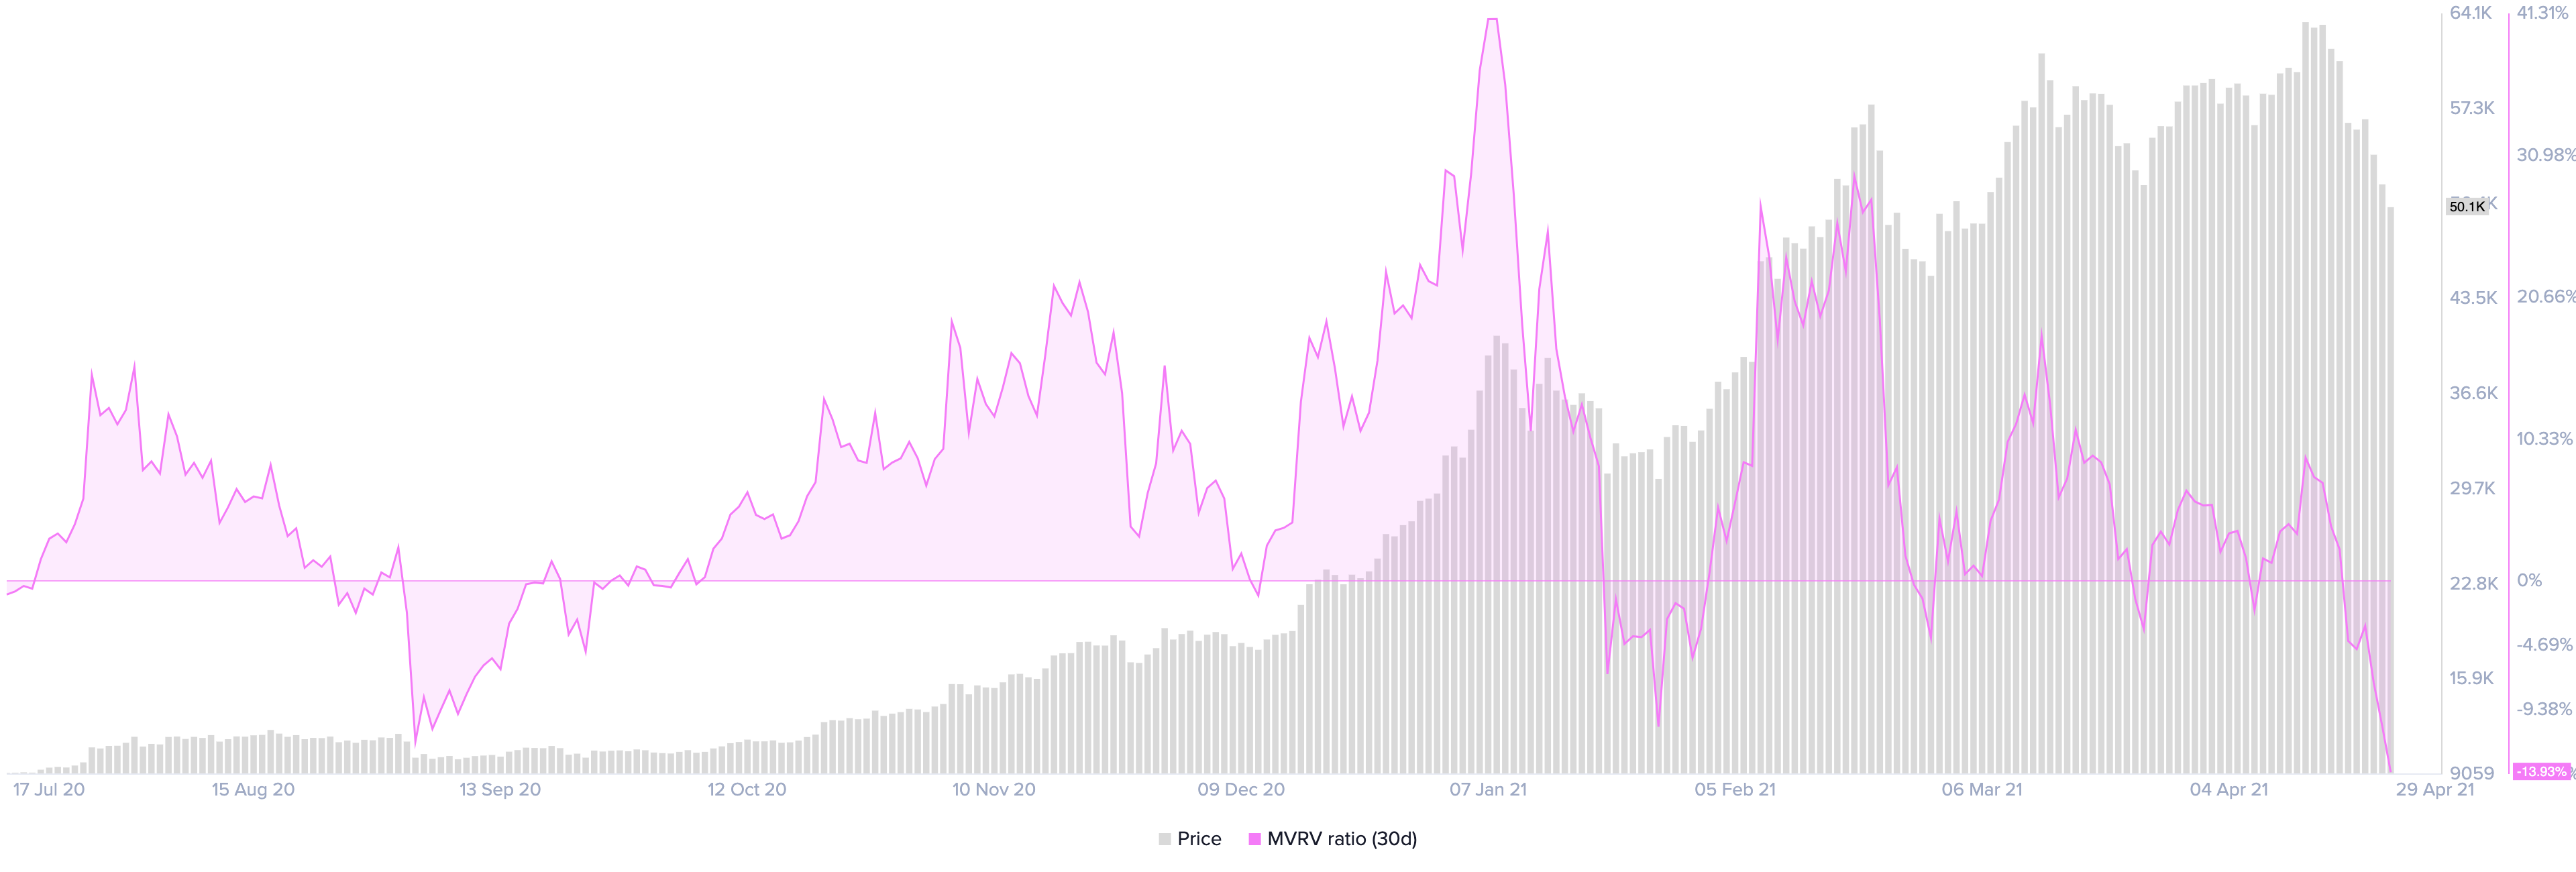
Despite the grim scenario, the Market Value to Realized Value (MVRV) suggests that Bitcoin has dropped into the “opportunity zone.” This fundamental index measures the average profit or loss of addresses that acquired BTC tokens in the past month.
Each time the 30-day MVRV moves below 0%, a bullish impulse tends to follow since most of the tokens in circulation are at a loss. The lower the MVRV ratio becomes, the higher the buying pressure that follows.
The 30-day MVRV ratio is now hovering at -13.93%, indicating Bitcoin is currently undervalued. The last time this on-chain metric reached such a low level was mid-March 2020 after Black Thursday, leading to complete price recovery.
As long as the 100-day moving average continues to hold, Bitcoin might have a chance to bounce back. But the pessimistic scenario would only be invalidated if BTC regains the 50-day moving average at $57,000 as support.
Ethereum Flashes Sell Signal
Ethereum made headlines after surging to a new all-time high of $2,650 recently. The bullish impulse seems to have been triggered by a significant increase in the number of whales on the network. Roughly 24 addresses with 10,000 to 100,000 ETH were created between Apr. 17 and Apr. 22.
The milestone was met with panic selling among investors after CNBC released a report alleging that U.S. President Joe Biden plans to raise capital gains tax to 39.60% for Americans earning more than $1 million.
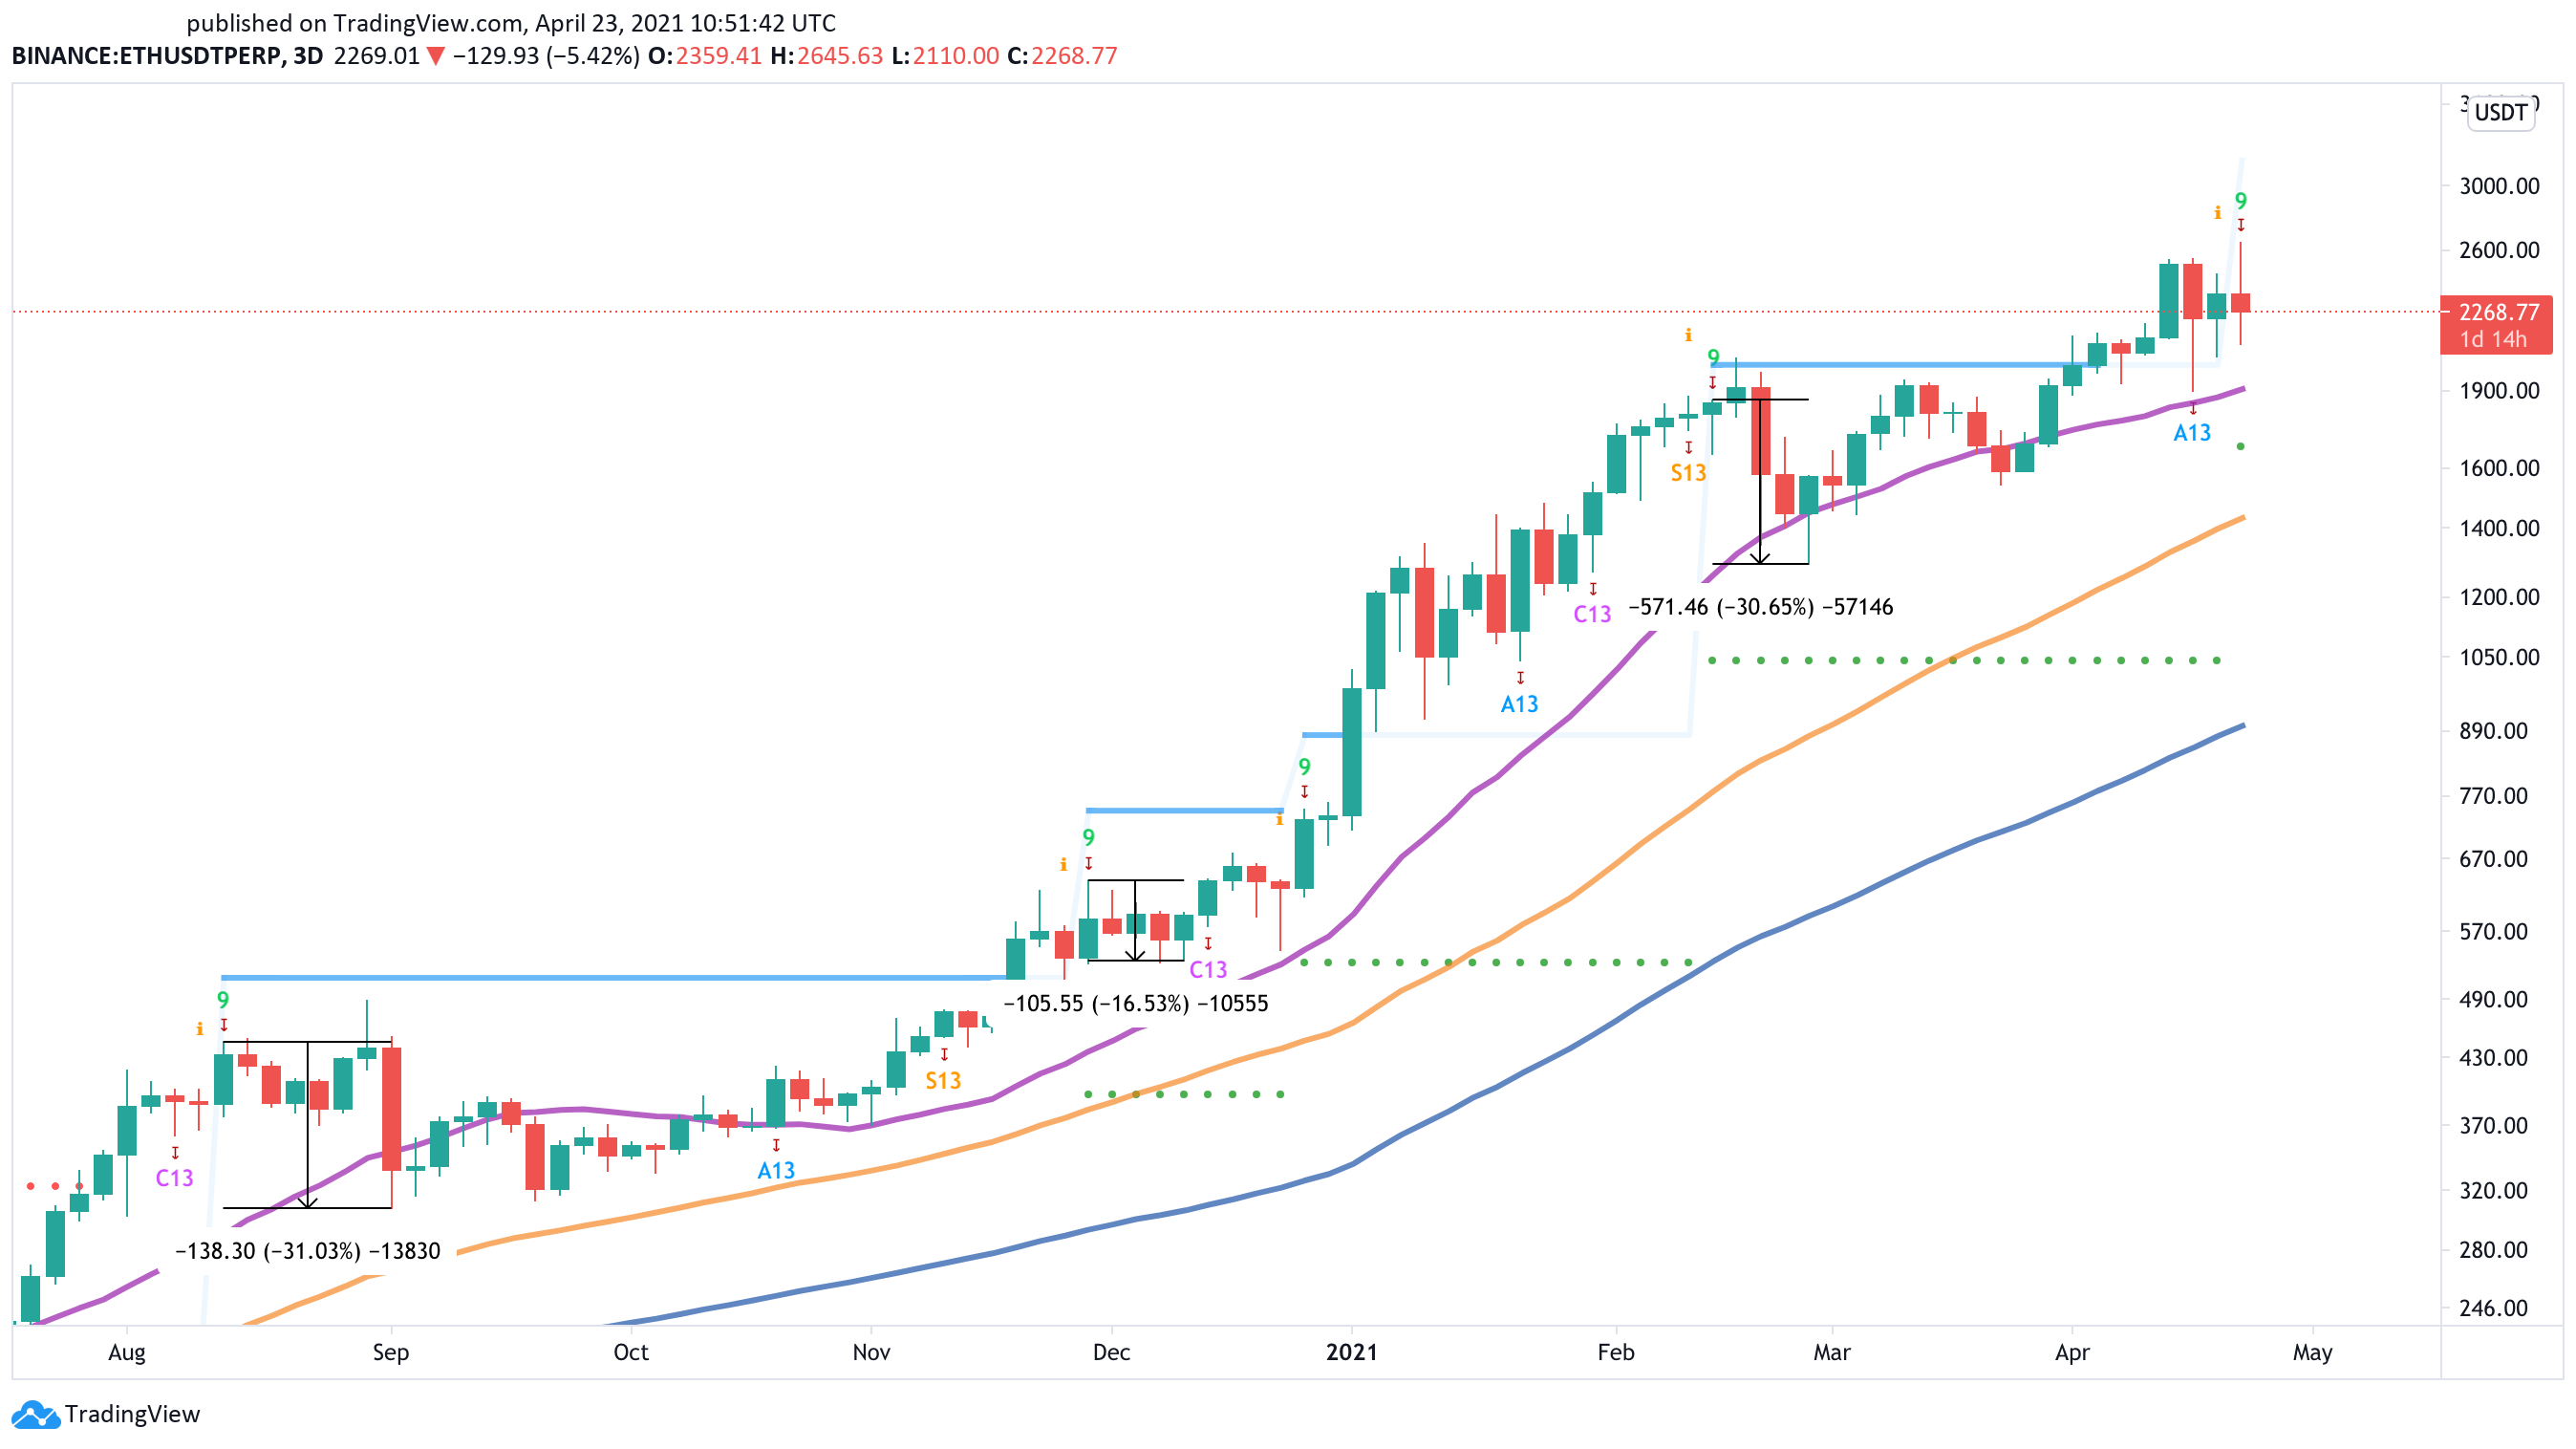
The sudden spike in downward pressure saw Ethereum’s market value plunged by more than 20%, shedding 540 points within a few hours. Now, the Tom DeMark (TD) Sequential indicator forecasts that Ether is poised to retrace further.
This technical index recently presented a sell signal in the form of a green nine candlestick on ETH’s 3-day chart. The bearish formation anticipates that Ether is bound for a one to four 3-day candlesticks retracement before the uptrend resumes.
A look at Ethereum’s 3-day chart reveals that the TD setup has been incredibly accurate at anticipating local tops on this altcoin’s trend. The three sell signals that this indicator has presented since August 2020 were all validated, resulting in significant retracements.
IntoTheBlock’s “Global In/Out of the Money” (GIOM) model estimates that $1,900 plays a crucial role in Ethereum’s trend. Based on transaction history, this is the largest demand barrier underneath this altcoin.
Here, nearly 2.30 million addresses had previously purchased roughly 17.80 million ETH. This area could absorb some of the selling pressure, preventing Ethereum from falling further.
That said, breaking through this support barrier could be catastrophic for those betting on the upside. The GIOM cohorts show that the next significant demand wall reinforcing Ether’s uptrend sits around $1,600.
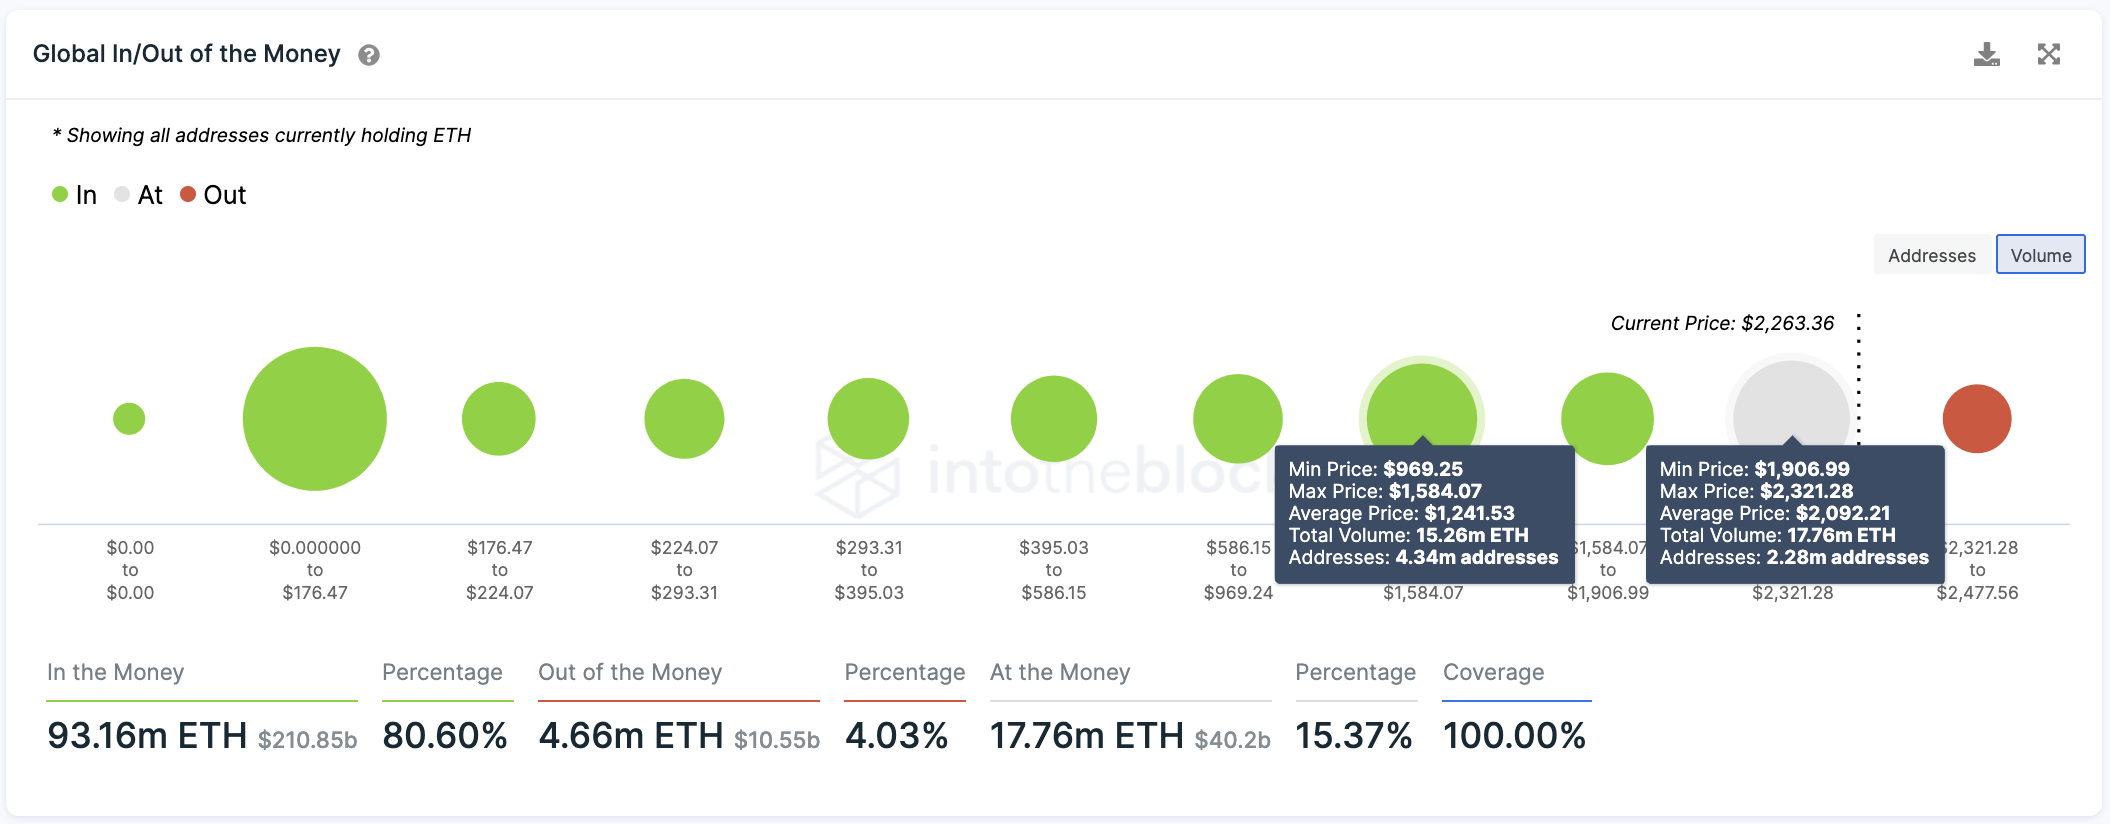
Given the cryptocurrency market’s unpredictability, the bullish outlook cannot be taken out of the question.
The GIOM cohorts model shows that there is only one major supply barrier ahead of Ethereum. Roughly 970,000 addresses hold 4.70 million ETH at $2,400.
A 3-day candlestick close above this resistance level could invalidate the bearish outlook and lead to further gains.
XRP Driven by Ripple’s Legal Uncertainty
Market participants seem to have FOMO-ed into XRP after Judge Sarah Netburn denied the U.S. Securities and Exchange Commission (SEC) access to Ripple’s executives’ bank records.
The massive increase in buy orders behind this token pushed its market value by nearly 240% within ten days, going from a low of $0.58 to a three-year high of $1.96.
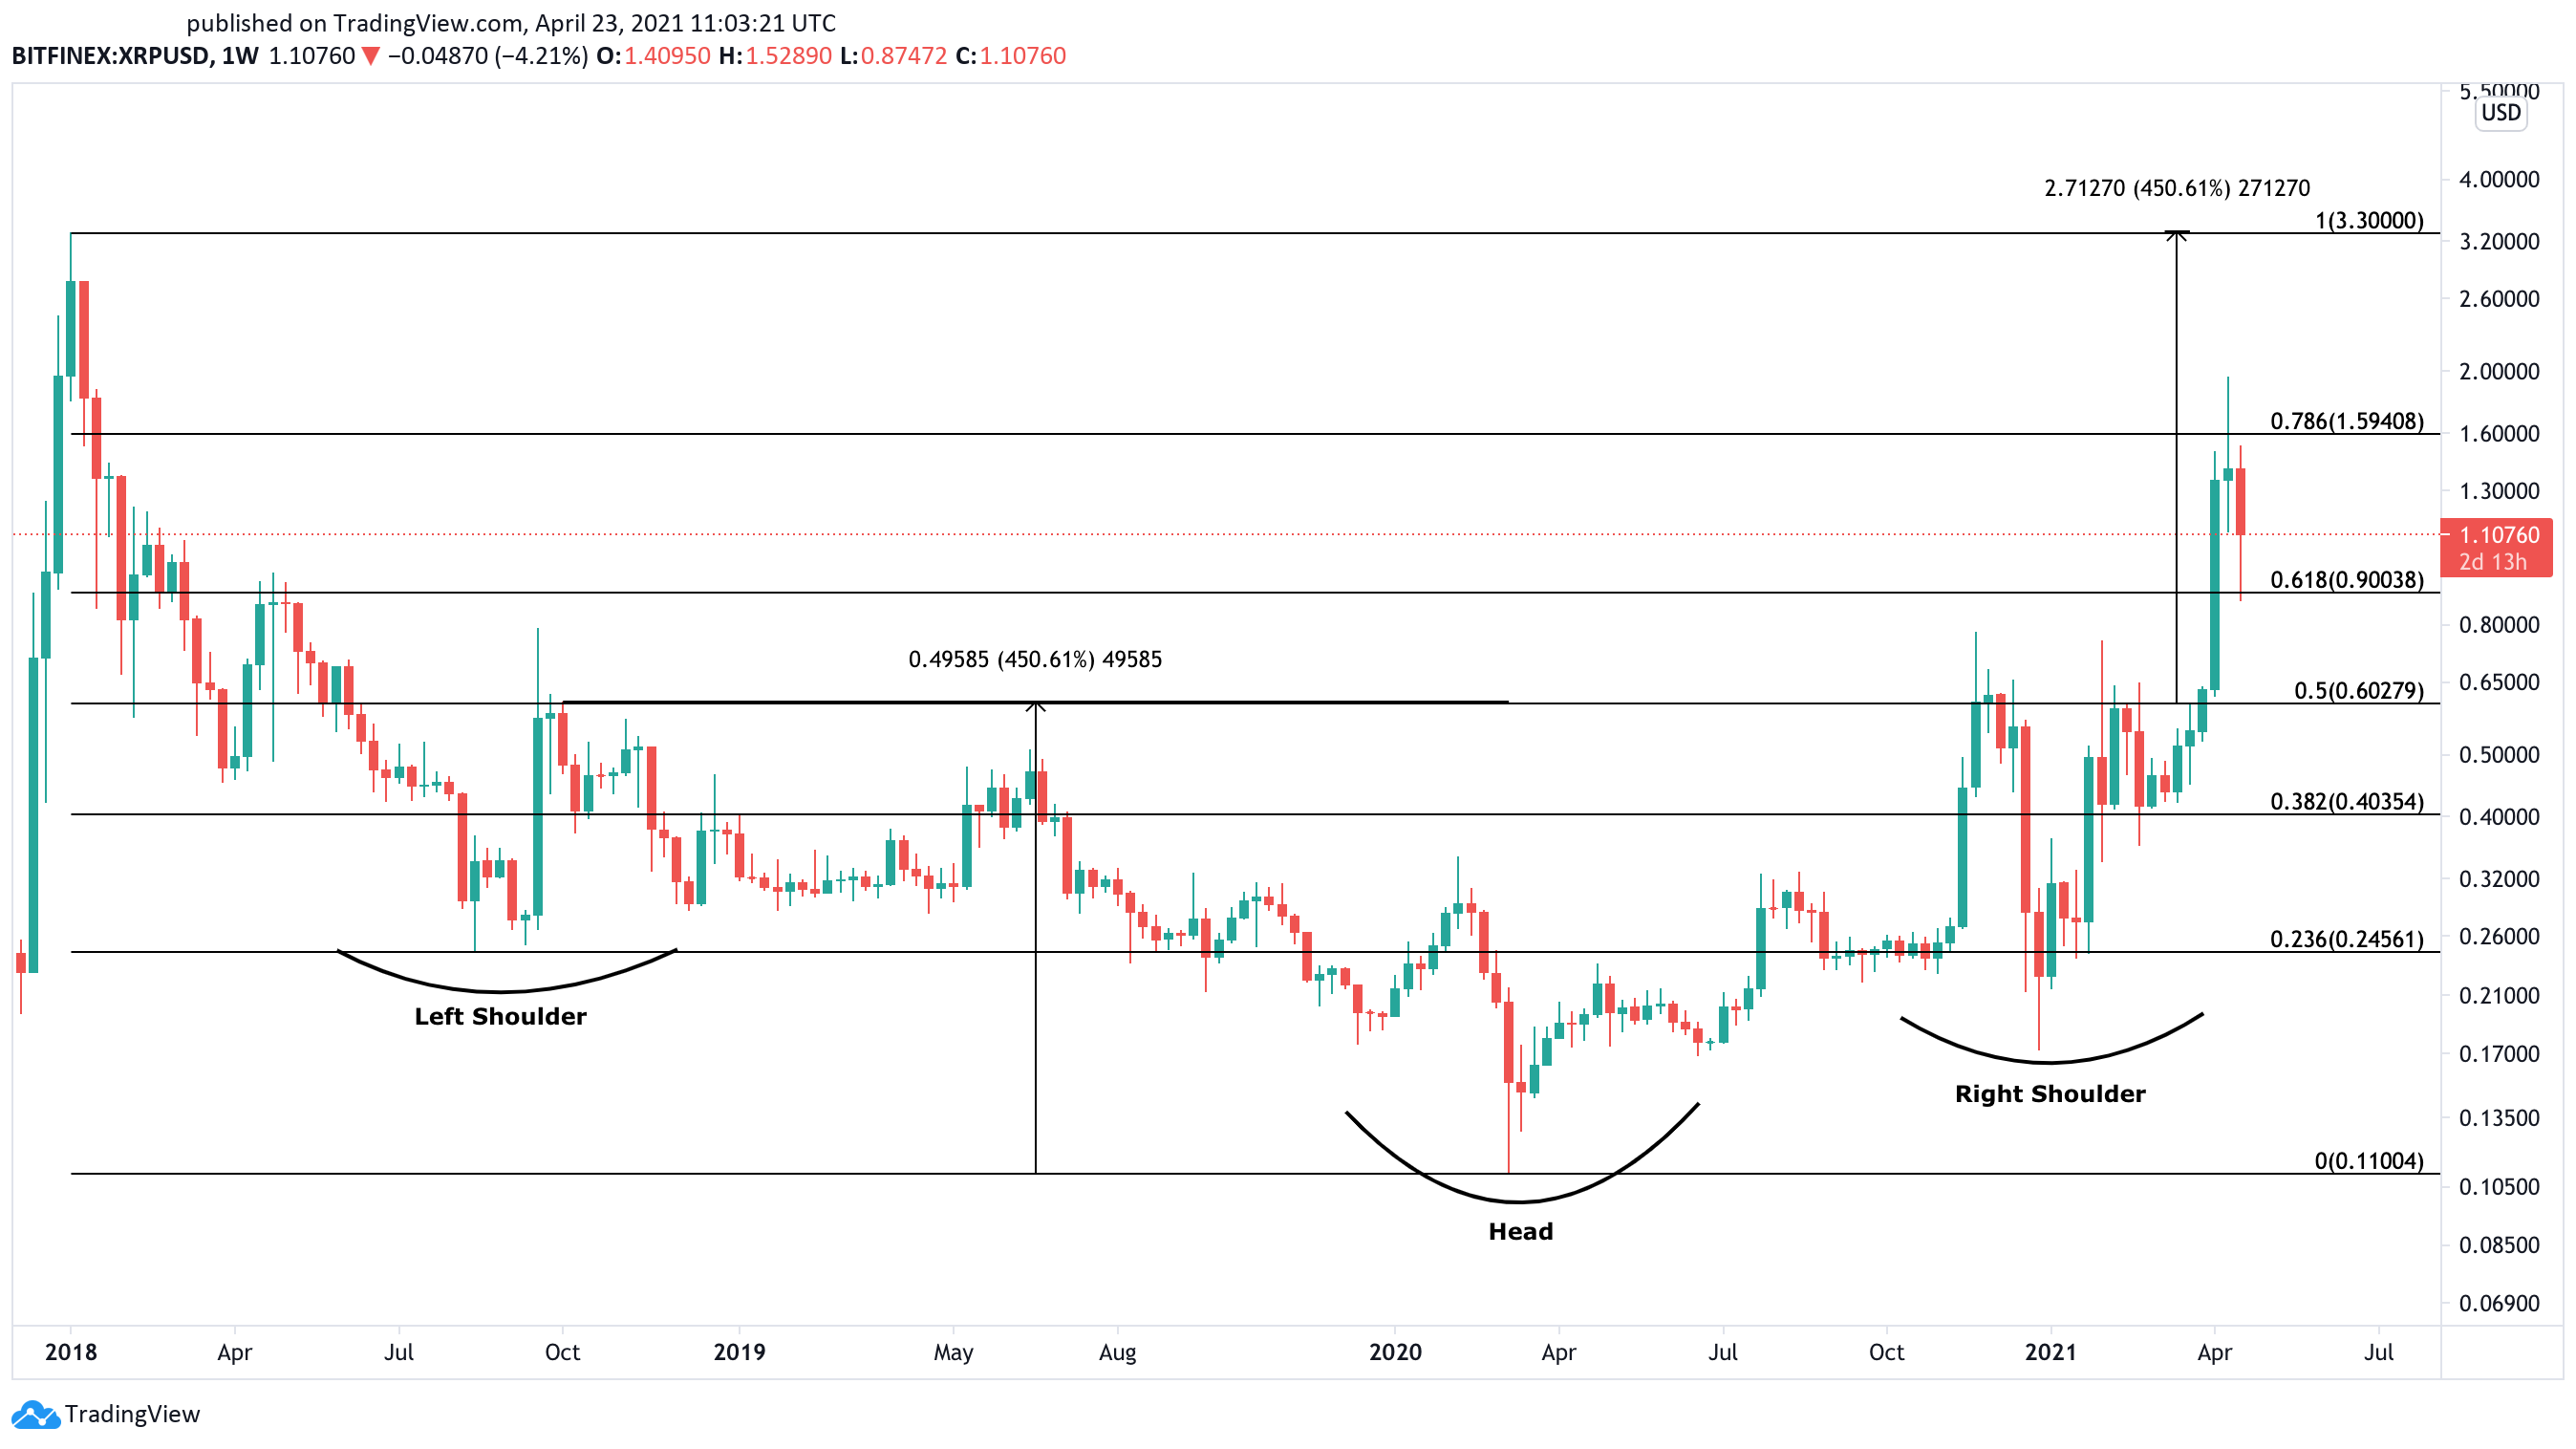
From a technical perspective, XRP broke out of an inverse head-and-shoulders formation that had been developing on its weekly chart since mid-June 2018. After moving past the pattern’s neckline at $0.60 on Apr. 4, the fourth-largest cryptocurrency went ballistic.
Now, XRP seems to be contained in a no-trade zone between the 78.6% and 61.8% Fibonacci retracement levels. A further increase in buying pressure that allows this altcoin to close above the overhead resistance at $1.60 could see it rise by another 100% toward the January 2018 all-time high of $3.30.
This target is determined by measuring the height between the pattern’s head and neckline and adding that distance upward from the breakout point.
Despite the optimism around the XRP community, Ripple isn’t out of its legal battle against the SEC yet.
The financial watchdog recently accused the distributed ledger startup of harassment. It alleged that the company had requested more documents than legally necessary in an attempt to “ignore the limitations of [the court order] and to mire the SEC in indefinite discovery disputes and…document review.”
Until Ripple’s legal issues are resolved, investors must keep an eye on the 61.8% Fibonacci retracement level at $0.90. Slicing through this support level could lead to a retest of the inverse head-and-shoulders neckline at $0.60.
Disclosure: At the time of writing, this author owned Bitcoin and Ethereum.