
Bitcoin Jumps Towards $9,000 as Bulls Return
Bitcoin breaks out in anticipation of the upcoming halving, recovering all the losses incurred during the March market meltdown.
The bullish momentum seen behind Bitcoin over the last few hours allowed it to turn the $8,000 resistance level into support, with BTC jumping more than 10%. Now, Bitcoin is well on its way to $9,000.
Bitcoin Is Breaking Out
In the beginning of the month, it was evident that Bitcoin was forming an ascending triangle on its 1-day chart. This technical formation is considered to be a continuation pattern that estimates a 34% target to the upside upon the breakout point.
Following the break out of the bullish formation on Apr. 6, the flagship cryptocurrency pulled back to the breakout point. At the time, Crypto Briefing explained that this retracement represented an opportunity for sidelined investors to get back into the market.
Such a “re-accumulation zone” was seen as the catalyst that will give BTC the strength to rise towards $9,000 to meet the target presented by the ascending triangle.
Indeed, the buying pressure behind the pioneer cryptocurrency was so significant around this area that it managed to push its price up by 23.5%. Now that Bitcoin moved past the $8,000 level, the previously optimistic $9,000 target seems closer than ever.
Nonetheless, the moving averages on the 1-week and 3-day chart suggest that Bitcoin may fall short of reaching this target.
The 50-week moving average and the 100-three day moving average are currently hovering around $8,700. When combined, the strength of these resistance barriers could put a momentary pause to BTC’s rise.
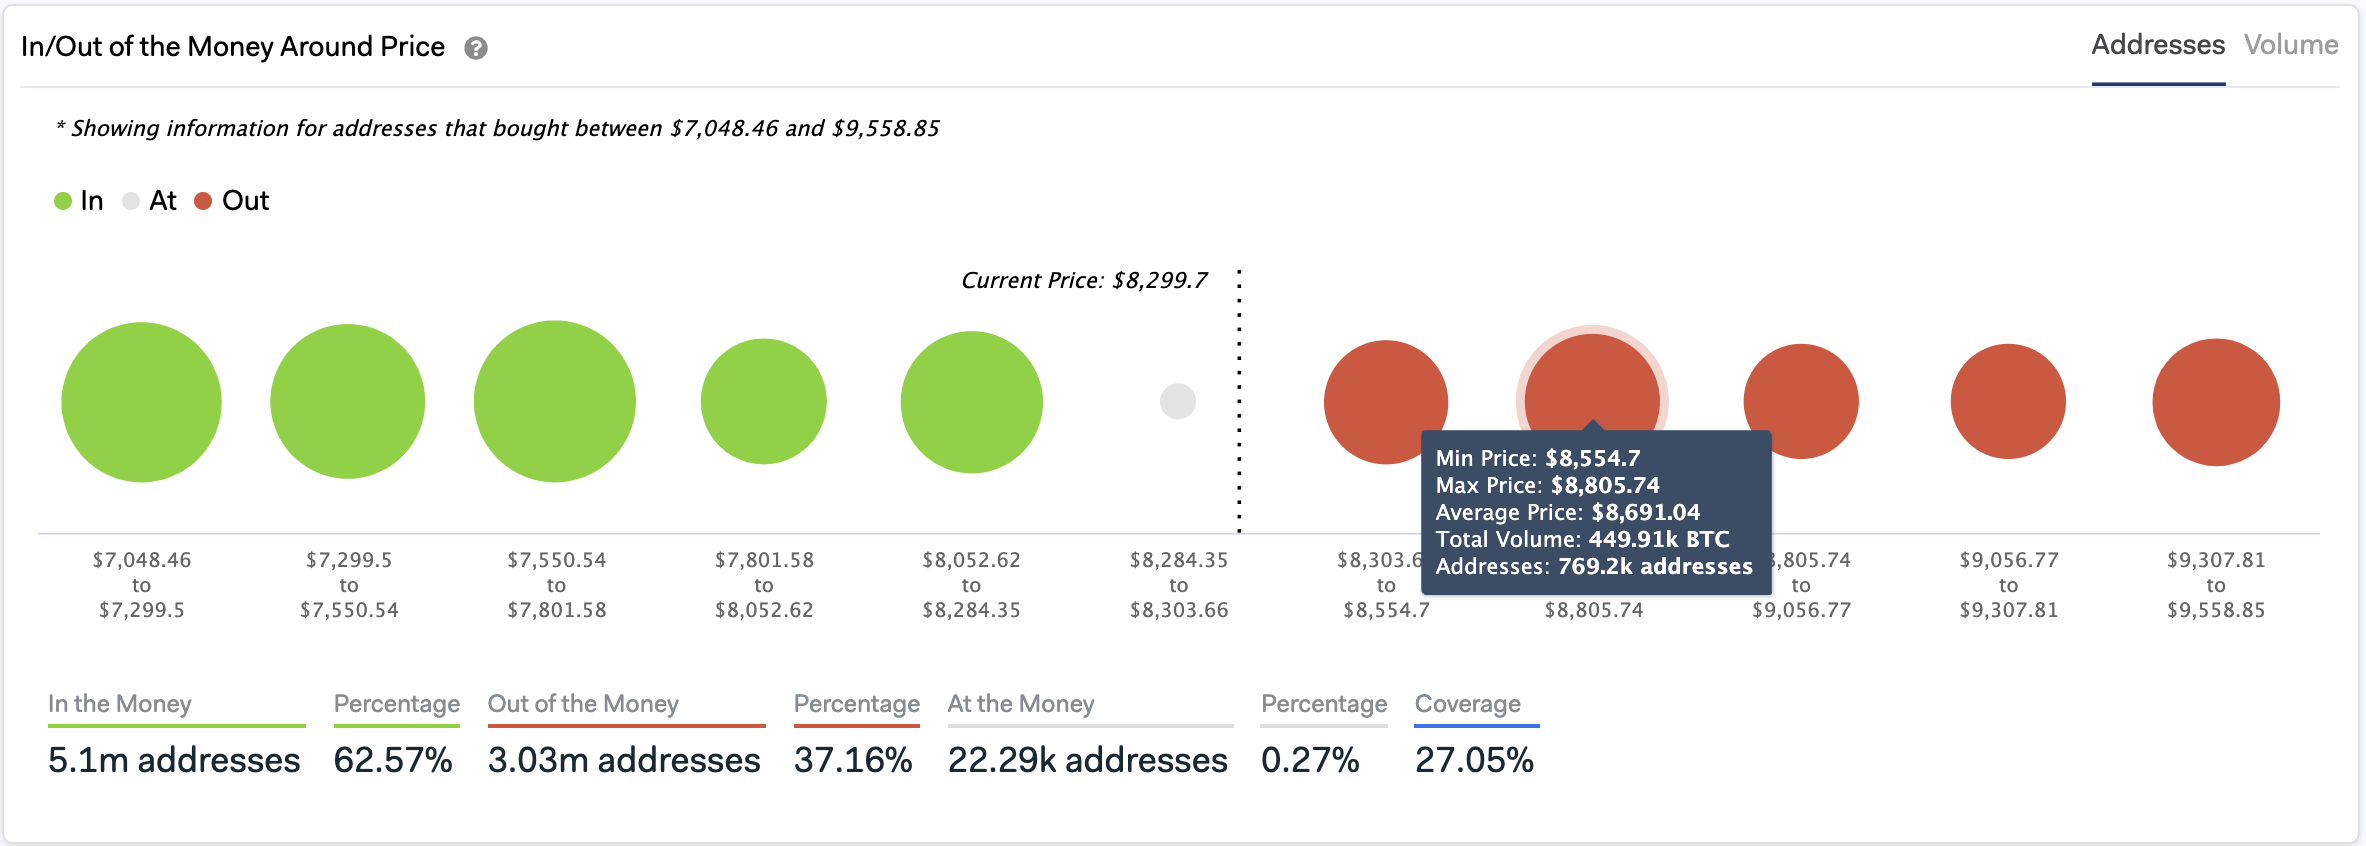
IntoTheBlock’s “In/Out of the Money Around Price” (IOMAP) model adds credence to the high probability of a rejection off the $8,700 resistance.
This fundamental index reveals that nearly 770,000 addresses bought 550,000 BTC around this price level. Such a massive supply wall may prevent the bellwether cryptocurrency from advancing further.
It is worth mentioning that a rejection from the overhead resistance would likely see Bitcoin retrace to its 50-three day moving average before it resumes the uptrend. This support barrier currently sits around $7,800.
Here, the IOMAP shows that 1.9 million addresses bought more than 1.4 million BTC, which may serve as a strong supply barrier as holders sell.
Overall Crypto Market Sentiment
Market participants are growing optimistic about what the halving has to offer. Although the short-term outcome of this event is not always positive, a lot of emphasis has been put into it.
The TIE maintains that “the halving has eclipsed coronavirus as the dominant narrative for Bitcoin” across Twitter and crypto media outlets.
Due to the ongoing state of commotion around the global economy, investors must be aware that a deep correction may occur before or after the hype around the halving is over. Thus, the implementation of a good risk management strategy is essential to protecting against losses from an unexpected fall.