
Bitcoin Moving Average Show Bull Markets In The Making
The Bitcoin Moving Average shows currenct and changing trends in the market: useful for predicting bull or bear markets.
Bitcoin’s (BTC) 200-day moving average (DMA) continues to slide in the longest downward trend since the summer of 2014.
Price data collected over the last 200-days indicates the Bitcoin moving average fell from $10,300 in early June to today’s $8,300. Although still $2,000 higher than the $6,150 moving average at the start of 2018, this is the first declining trend for the 200-DMA in three years. The last slide saw the average decline from $650 in June 2014, to $250 in July 2015.
Traders use DMAs to determine an asset’s price-trend overtime and to identify changes to the established trend. They are calculated by dividing the sum total of past closing prices – within a certain timeframe – over the number of days. A rising DMA indicates an asset is an uptrend, with a declining DMA showing a downtrend.
The number of days included in a DMA depends on what it is being used for. Longer averages like a 200-DMA are useful for ‘hodlers’; traders with short-term positions benefit more from a 20-day or 50-day moving average.
Although based on past trends they can predict imminent future market trends. Traders watch for ‘golden-crosses’ when a 50-day DMA crosses over a 200-DMA, which is a bullish signal for the market; they also watch for ‘death-crosses’, when the 50-day average goes below that of the 200-DMA.
Moving averages help filter out noise from unexpected or sudden price spikes; longer DMAs having smoother curves. For a volatile asset like cryptocurrency, denounced in a recent UBS report as ‘unstable’, this is particularly useful. Shot sharp drops in the BTC-price, like following the SEC’s rejection of the Winklevoss’ Bitcoin ETF, would not greatly affect the trend shown by a longer-term bitcoin moving average.
As the graph below shows, Bitcoin hit a death cross back at the end of March this year. Since then, the gap between the 50 and 200-DMAs has decreased; with the recent BTC-price hike pulling them close together.
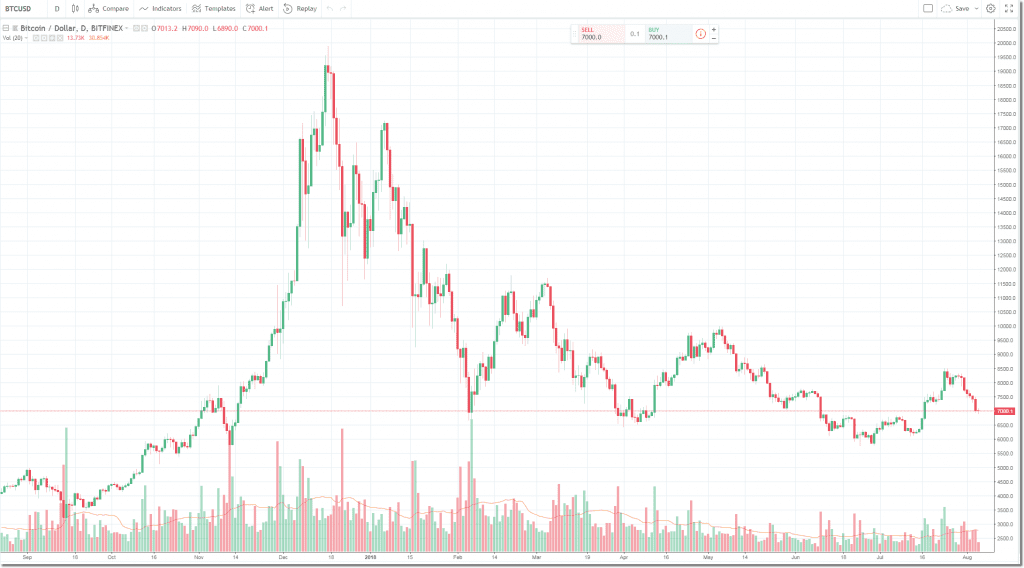
(Graph by Trading View)
Intercontinental Exchange, which owns the New York Stock Exchange, announced on Friday it was launching a new US-regulated BTC market in November. Called Bakkt; it has the backing of Microsoft and Starbucks.
The DMA graph shows July’s bullish news over Bitcoin ETFs and greater institutional involvement helped to make that more of a possibility. August has so far been a disappointing month for the BTC price. Breaking past $8,000 early last week, bitcoin has just managed to hold itself above the $7,000 mark.
The author is invested in BTC, which is mentioned in this article.