
Bitcoin Price Analysis BTC / USD: Short Term Pain, Long Term Gain?
Most indicators are too overstretched for further short-term gains.
- Bitcoin has a bullish short-term bias, with the cryptocurrency trading at its highest level since March 2018
- The four-hour time frame shows that the BTC / USD pair has reached its invalidation target
- The daily time frame shows that the recent advance has created a huge inverted head and shoulders pattern
Bitcoin / USD Short-term price analysis
Bitcoin has a bullish short-term trading outlook, with the BTC / USD pair advancing to its highest trading level since March 2018.
The four-hour time frame is showing that the BTC / USD pair has performed a strong technical breakout after invalidating a bearish head and shoulders pattern.
Key technical resistance is currently located at the $11,200 and $11,320 levels.
Technical indicators on four-hour time frame remain bullish, although they are starting to appear extremely overstretched.

Pattern Watch
Traders should note that the recent upside move has reached its full invalidation target on the four-hour time frame.
Relative Strength Index
The Relative Strength indicator on the four-hour time frame remains bullish, although it is now correcting from extreme overbought conditions.
MACD Indicator
The MACD indicator on the four-hour time frame appears extremely oversold and is attempting to turn bearish.
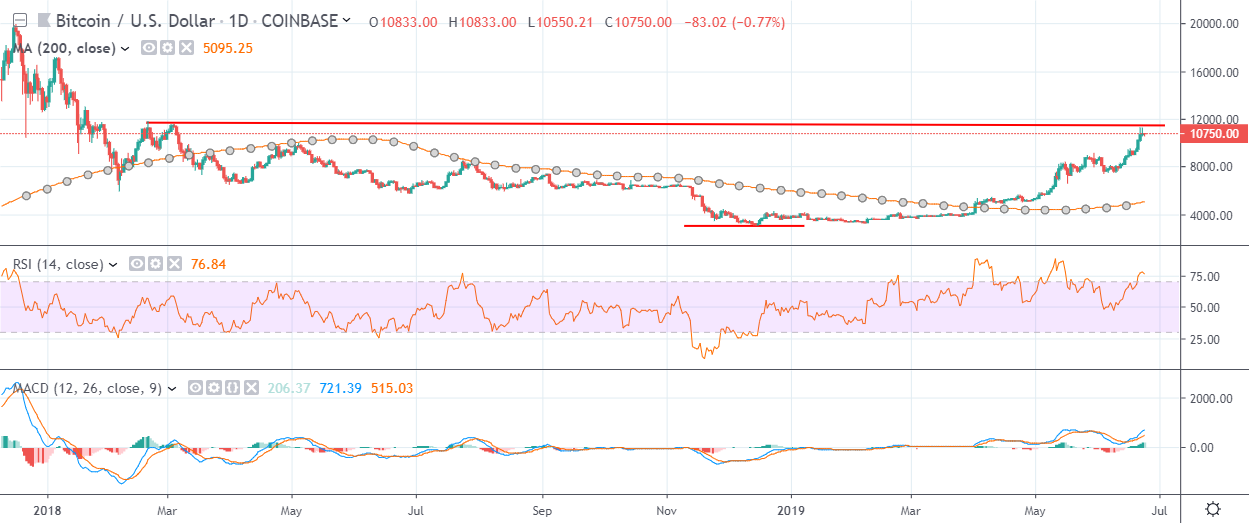
Bitcoin / USD Medium-term price analysis
Bitcoin has a bullish medium-term trading outlook, with the BTC / USD pair briefly moving above the $11,000 resistance level.
The daily time frame is showing that the recent move higher has created an extremely large inverted head and shoulders pattern, with the BTC / USD pair currently trading under the neckline of the bullish pattern.
Key technical resistance on the daily time frame is currently located at the $11,400 and $11,800 levels, while the $10,600 now provides major technical support.
Technical indicators on the daily time frame remain bullish and are approaching overbought conditions.
Pattern Watch
Traders should note that the recently created inverted head and shoulders pattern on the daily time frame has an overall upside target that would take the BTC / USD pair towards the $18,000 level.
Relative Strength Index
The Relative Strength indicator on the daily time frame is extremely overbought and is also showing bearish price divergence.
MACD Indicator
The MACD indicator on the daily time frame is bullish and continues to issue a strong buy signal.
Conclusion
Bitcoin has staged another powerful move higher, with BTC / USD slicing through the $10,000 resistance barrier with relative ease.
The short-term technicals now appear overstretched, while the bearish RSI price divergence on the daily time frame is also warning that the cryptocurrency may be approaching an interim price peak over the medium-term.
What propelled Bitcoin to $11,000? Here are some clues.
Bitcoin was the first of our coin guides, and is also our highest-rated deep research project.