
Bitcoin Rally Slows as Technicals Indicate an Imminent Bearish Correction
Bitcoin made headlines after rising to new yearly highs. Still, fundamental and technical indicators suggest a correction is underway.
Bitcoin rose to new yearly highs attracting sweeping interest from crypto enthusiasts, but different metrics suggest that the top token’s trend has reached exhaustion, and prices are bound to retrace.
Bitcoin’s Social Engagement Metrics Explode
The flagship cryptocurrency stole the spotlight after this week’s impressive bull rally.
Following a two-month-long consolidation period where its price was stuck within a bullish pennant, BTC was finally able to break out.
The upswing allowed it to smash through the infamous $10,000 resistance barrier and hit a new yearly high of nearly $11,500.
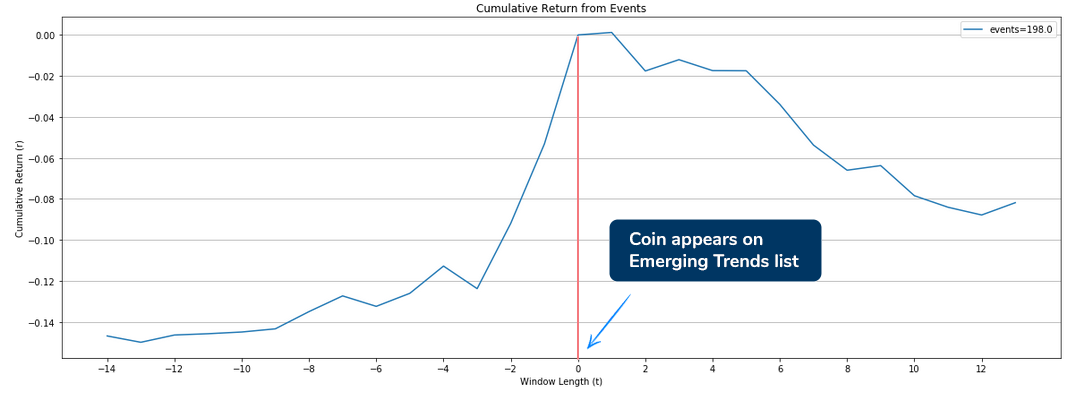
The number of BTC-related mentions on social media exploded as crypto enthusiasts entered a state of FOMO. The rising chatter around the pioneer cryptocurrency allowed it to move to the top of Santiment’s Emerging Trends list, which is a historically negative sign.
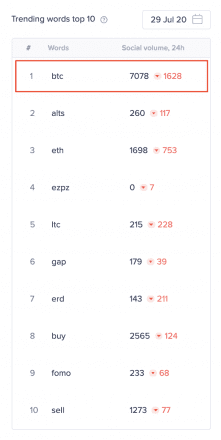
Dino Ibisbegovic, head of content and SEO at Santiment, maintains that when the crowd pays increased attention to a given digital asset because of an ongoing pump, it indicates that prices have reached “peak hype.”
“Extreme social volumes are rarely positive for the coin’s short-term price performance, especially if/when they materialize during a pump. These social peaks often point to rising FOMO and irrational market confidence, otherwise known as a perfect time for the coin’s whales to offload some of their bags,” said Ibisbegovic.
Bitcoin’s rally was able to attract a lot of interest from market participants, which may affect its short-term performance. Although it recently took an 8% nosedive, the TD sequential indicator estimates more losses.
Technicals Turn Bearish
This technical index recently presented a sell signal on both BTC’s 1-day and 12-hour chart.
The bearish formations developed in the form of green nine candlesticks. This type of technical pattern suggests that Bitcoin is poised to retrace for one to four daily candlesticks before the uptrend resumes.
In the event of a correction, IntoTheBlock’s “In/Out of the Money Around Price” (IOMAP) model reveals that the bellwether cryptocurrency may find stiff support between $9,350 and $10,000.
Around these price levels, more than 3 million addresses had previously purchased roughly 2 million BTC.
This is a critical support level as holders within this price range will likely attempt to remain profitable on their positions. They may even buy more BTC to force prices to rebound towards higher highs.
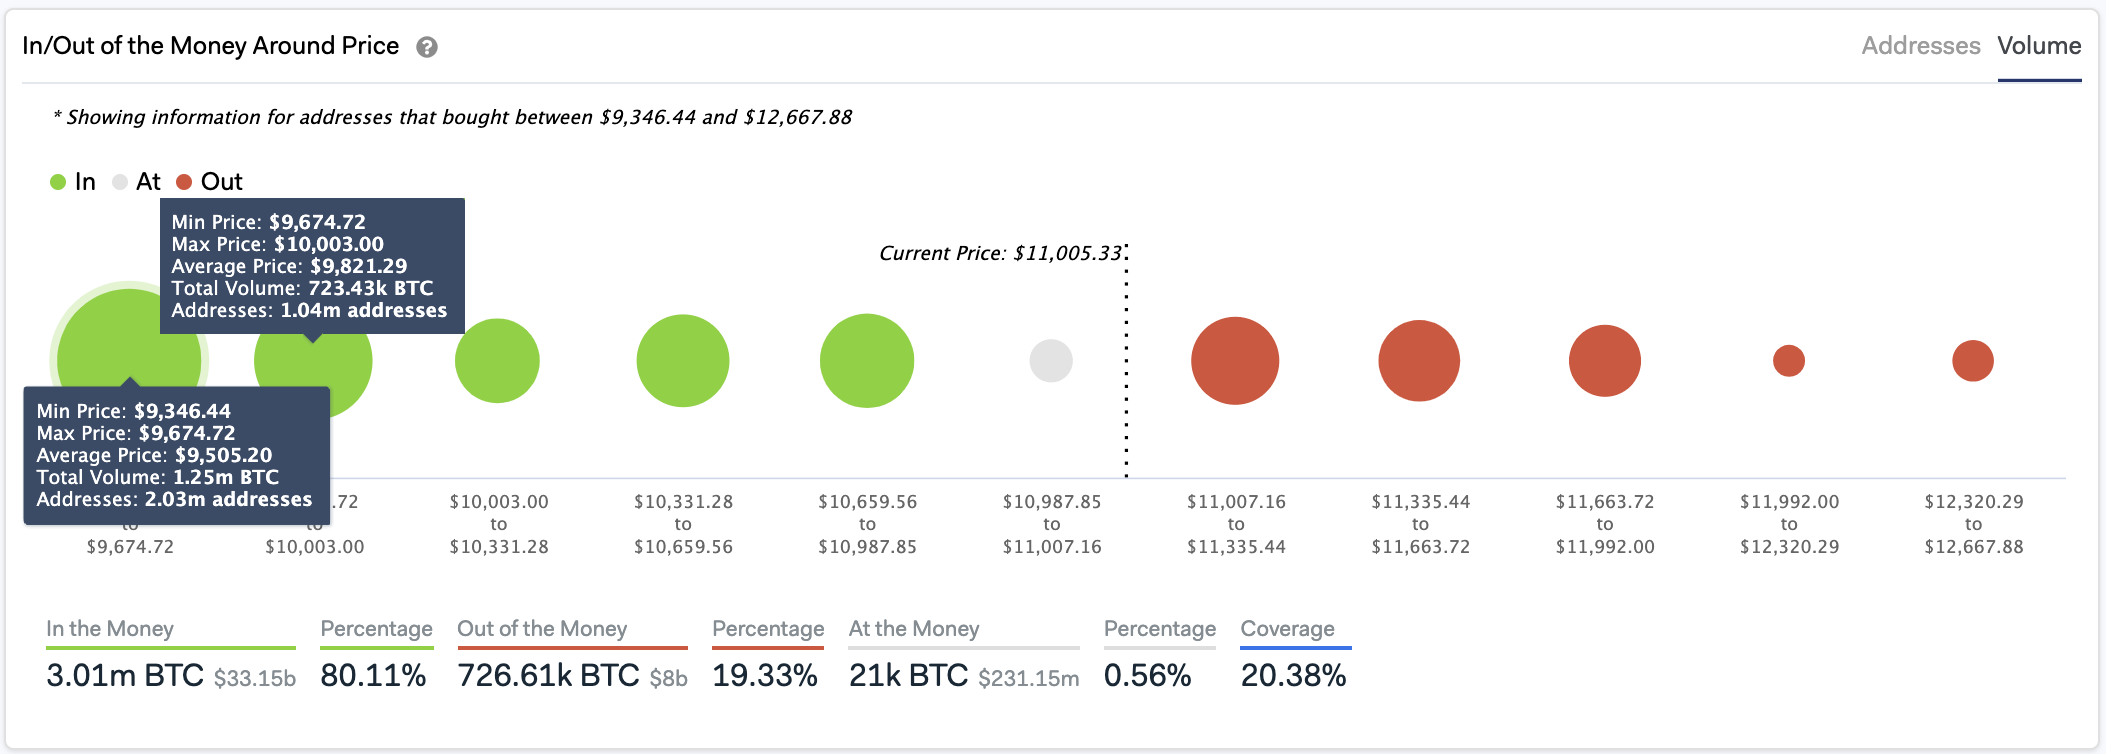
It is worth noting that the IOMAP cohorts do not show any significant resistance barrier ahead of Bitcoin that may prevent it from advancing further. Therefore, traders must be cautious about a potential upswing that sends prices above the recent high of $11,500.
Turning this price hurdle into support will increase the odds for another bull rally towards $13,000.