
Bitcoin Still Undervalued Based on These On-Chain Indicators
Bitcoin's growing on-chain activity projects higher prices for the cryptocurrency both in the short and long-term.
Bitcoin price indicators equivalent to the price-to-earnings (PE) ratio for stocks point towards an uptrend, according to leading on-chain analysts. The growth in total mining hashrate is also setting BTC up for more gains.
Bitcoin Undervalued, According to NVT Ratio
The PE ratio of a stock is the ratio between its share price and its earnings per share. A company’s earnings are defined by the profits, after-tax, distributed to shareholders for the financial year.
Since Bitcoin does not represent shares in a company and has no profits, its PE ratio can only be approximated with on-chain indicators—network value to transaction value ratio (NVT) and realized value to transaction ratio (RVT).
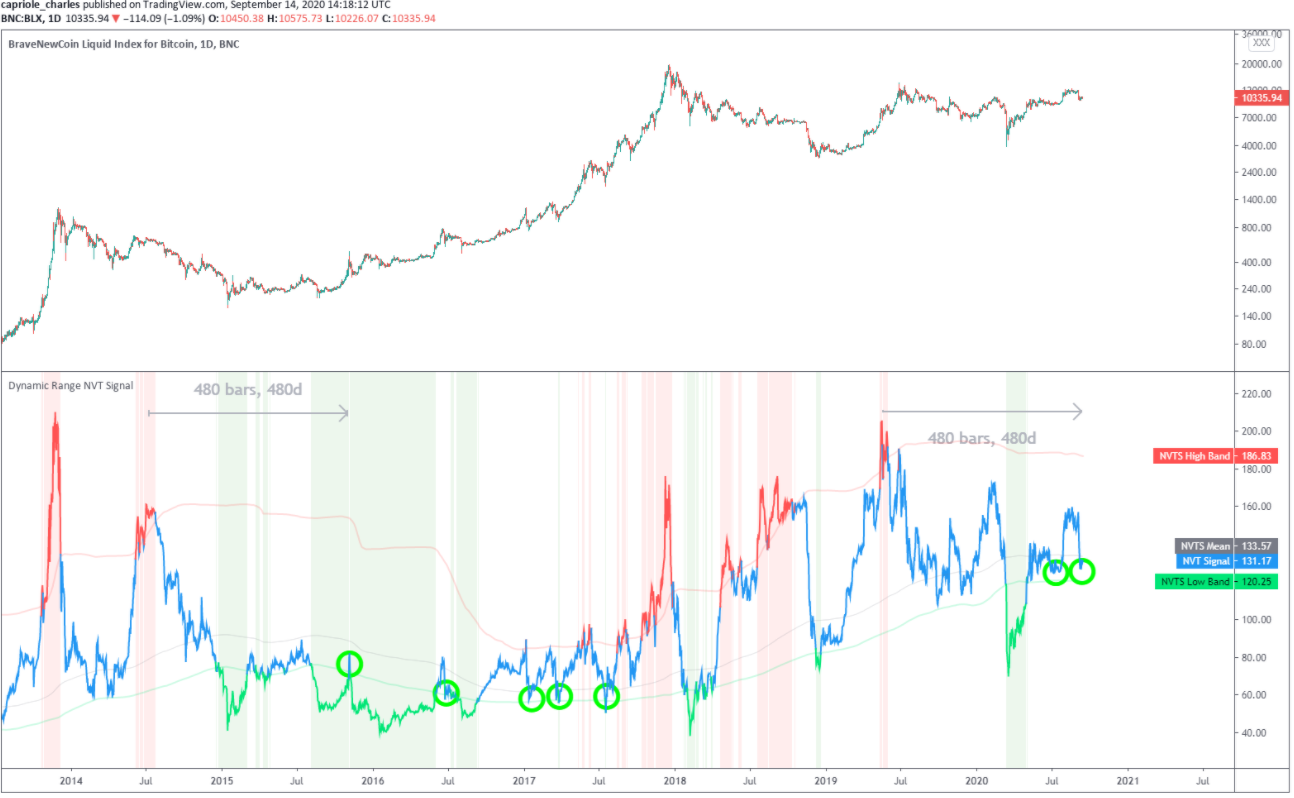
Introduced by the on-chain analyst Willy Woo and then later formalized as an indicator by Dimitry Kalichkin, NVT measures the ratio between the total market capitalization and the daily volume of on-chain transactions.
The value of the ratio oscillates between the upper and lower band, indicating overbought and oversold conditions in the market. Currently sitting at 131, the ratio suggests that market prices should increase relative to Bitcoin’s on-chain activity.
“Similar historic periods of Dynamic Range NVT undervaluation (and similar time spans from overvaluation) have been volatile, but in hindsight mostly for buying,“ says the founder of Capriole Investments Charles Edwards.
The movement shows similarities with Bitcoin’s accumulation phase in 2015 when prices were less than $500 per coin. BTC went on to an all-time high of $20,000 in the next two years.
RVT Post Bullish BTC Sign
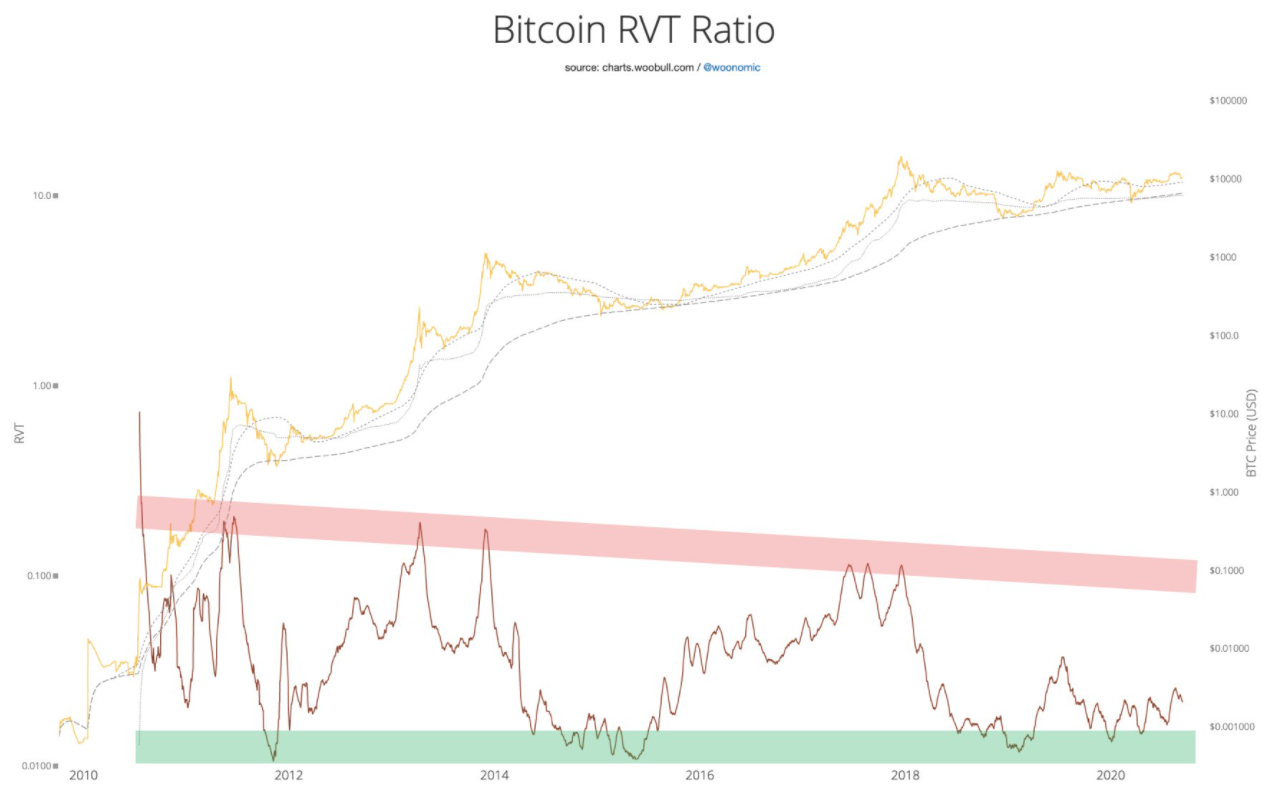
An improvement over the NVT ratio is the RVT ratio, also introduced by Woo. Realized market cap values each Bitcoin at the price it last moved on-chain, eliminating dormant and lost coins from the calculation. The realized market capitalization value to transaction ratio is an exceptional metric for assessing whether the market is overbought or oversold.
Woo points out that there is a “lot of room for growth in this cycle.” In fact, the RVT ratio still hasn’t reached the bullish levels attained during 2016-2017.
Furthermore, Bitcoin miners are also projecting confidence in BTC’s long-term value. Despite the halving, which reduced block rewards by 50% to 6.25 BTC, the mining industry has experienced steady growth. This supplements the on-chain strength of the network in terms of security and economic value.
Miners are looking to add back to the network as it reached new highs in the total hashrate. According to Woo, it is “quite a reliable indicator of bullishness.”
He also suggests that while he is “cautious of another short term dump,” the probability of a price surge increases as buyers waiting for the CME Gap to fill at $9,600 are front-run. He tweeted:
“…strongly bullish if we break resistance here. There’s a lot of bids in the spot order books wanting to snap up the gap in the mid-high 9000s.”
The resistance above $12,000 is considerable as sellers have stepped in each time prices breached this resistance.
Bitcoin Holders Have Strong Hands
On-chain indicators are reliable sources for estimating the intrinsic value of BTC. Profitable margins for miners and increased network usage promote innovation around Bitcoin, on both the supply and demand side.
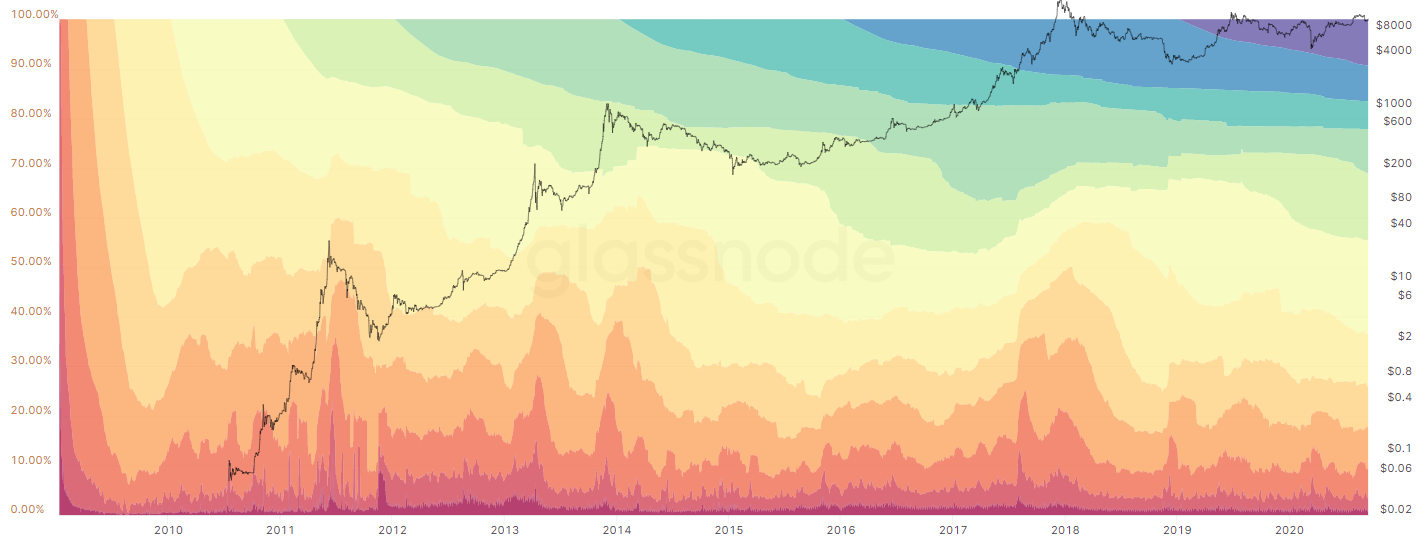
Moreover, the confidence of hodlers has only gotten stronger with the extreme price fluctuations between $3,800 and $12,500 this year. Close to 63% of the total supply has been held in the same addresses for the last 1-2 years.
Wide-scale liquidations are only likely in the event of an isolated catastrophe in crypto similar to the Black Thursday crash in March. Even then, Bitcoin will not die—it will come back even stronger.