
Bitcoin Falls Below $8,000: Will Support Hold And The Triple Top Pattern Repeat?
The past may offer some insight into the future.
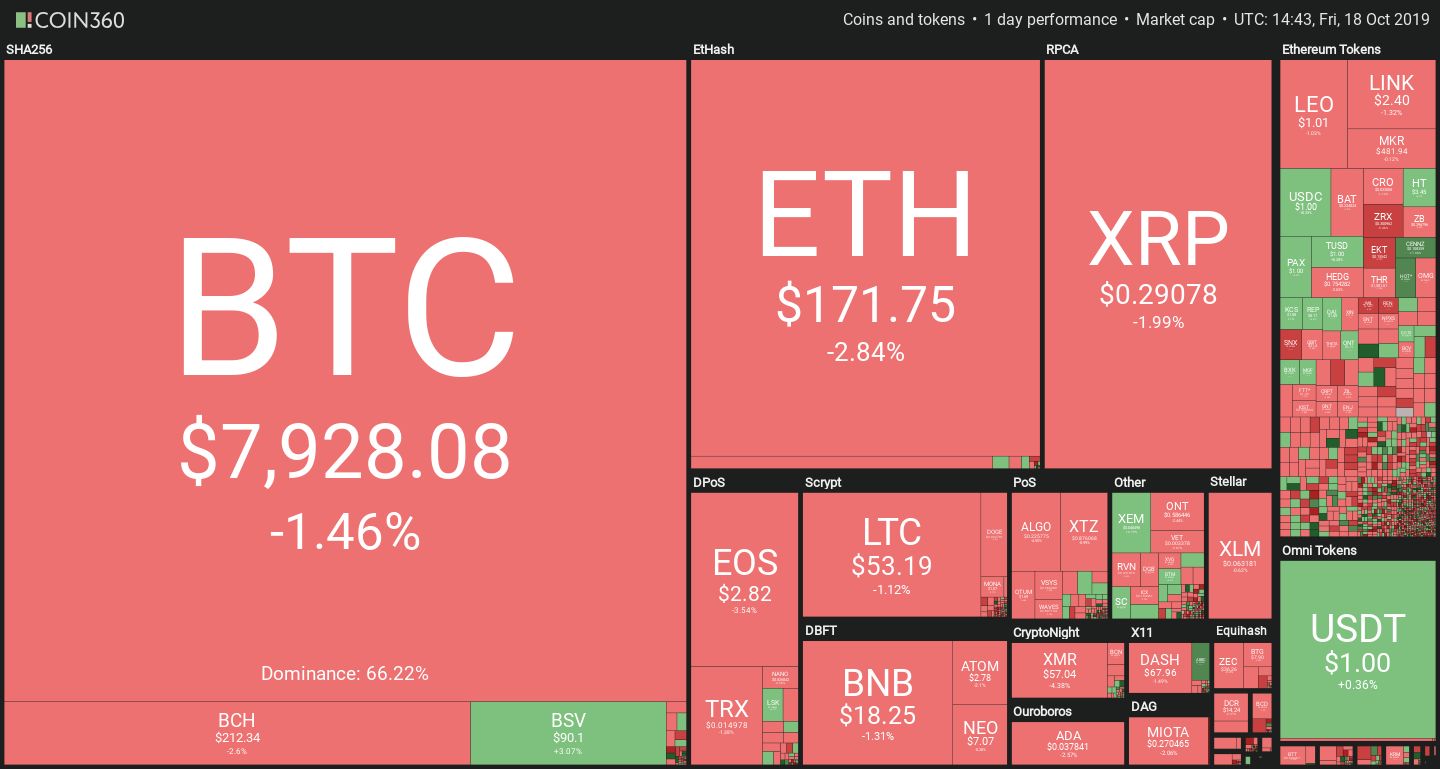
Bitcoin is back below $8,000 today, dragging down most of the altcoins with it. Virtually the entire market is down with figures ranging from 1% to 3%, though Holochain and BSV are exceptions with +5% and +2% performances on the day.
Is Bitcoin’s support waning?
The current price setting shows some peculiarities, as parallels from the past contrast with some unique factors.
Looking back at the early months of the 2016-17 bull market, sudden 20% falls were actually not uncommon. The summer of 2016 looks remarkably similar to this year’s – a meteoric first rise, followed by a couple of smaller price peaks. In Technical Analysis parlance this is a triple top pattern, which is a bearish sign if each peak establishes a lower high.
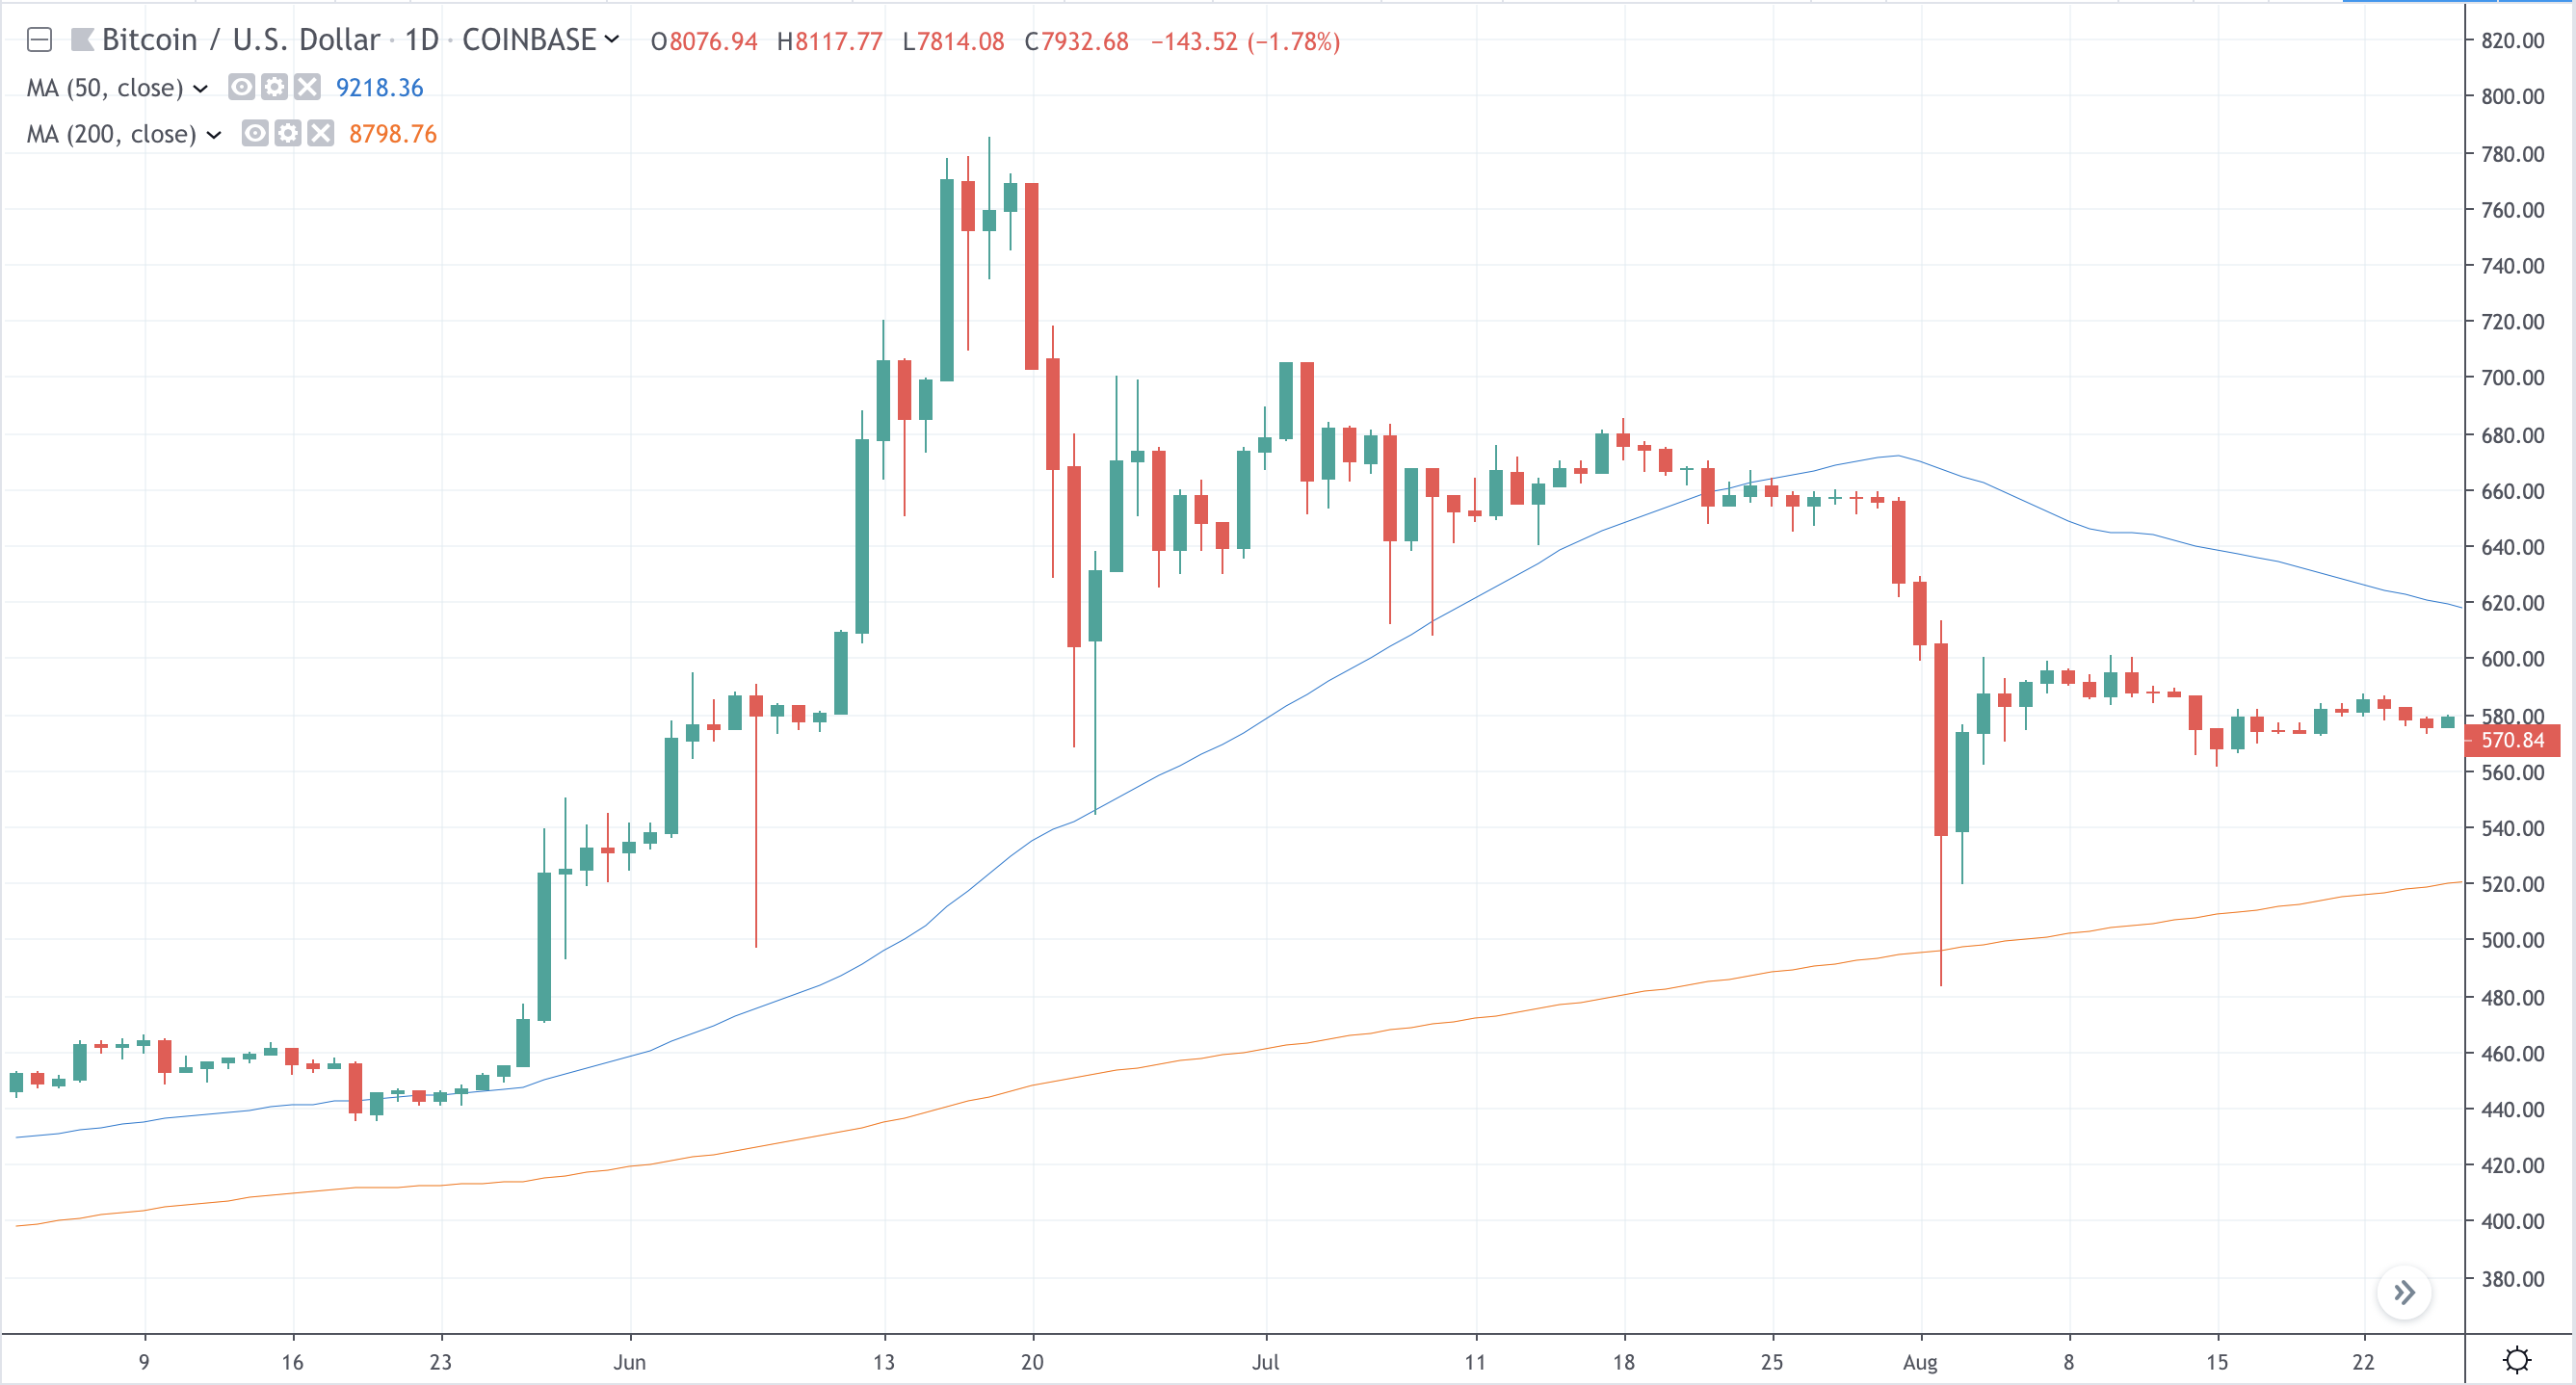
In 2016, a sudden 20% drop completed the pattern, ushering a period of low-volatility consolidation – but it regained momentum soon after. A similar 20% rollback happened earlier in January 2016.
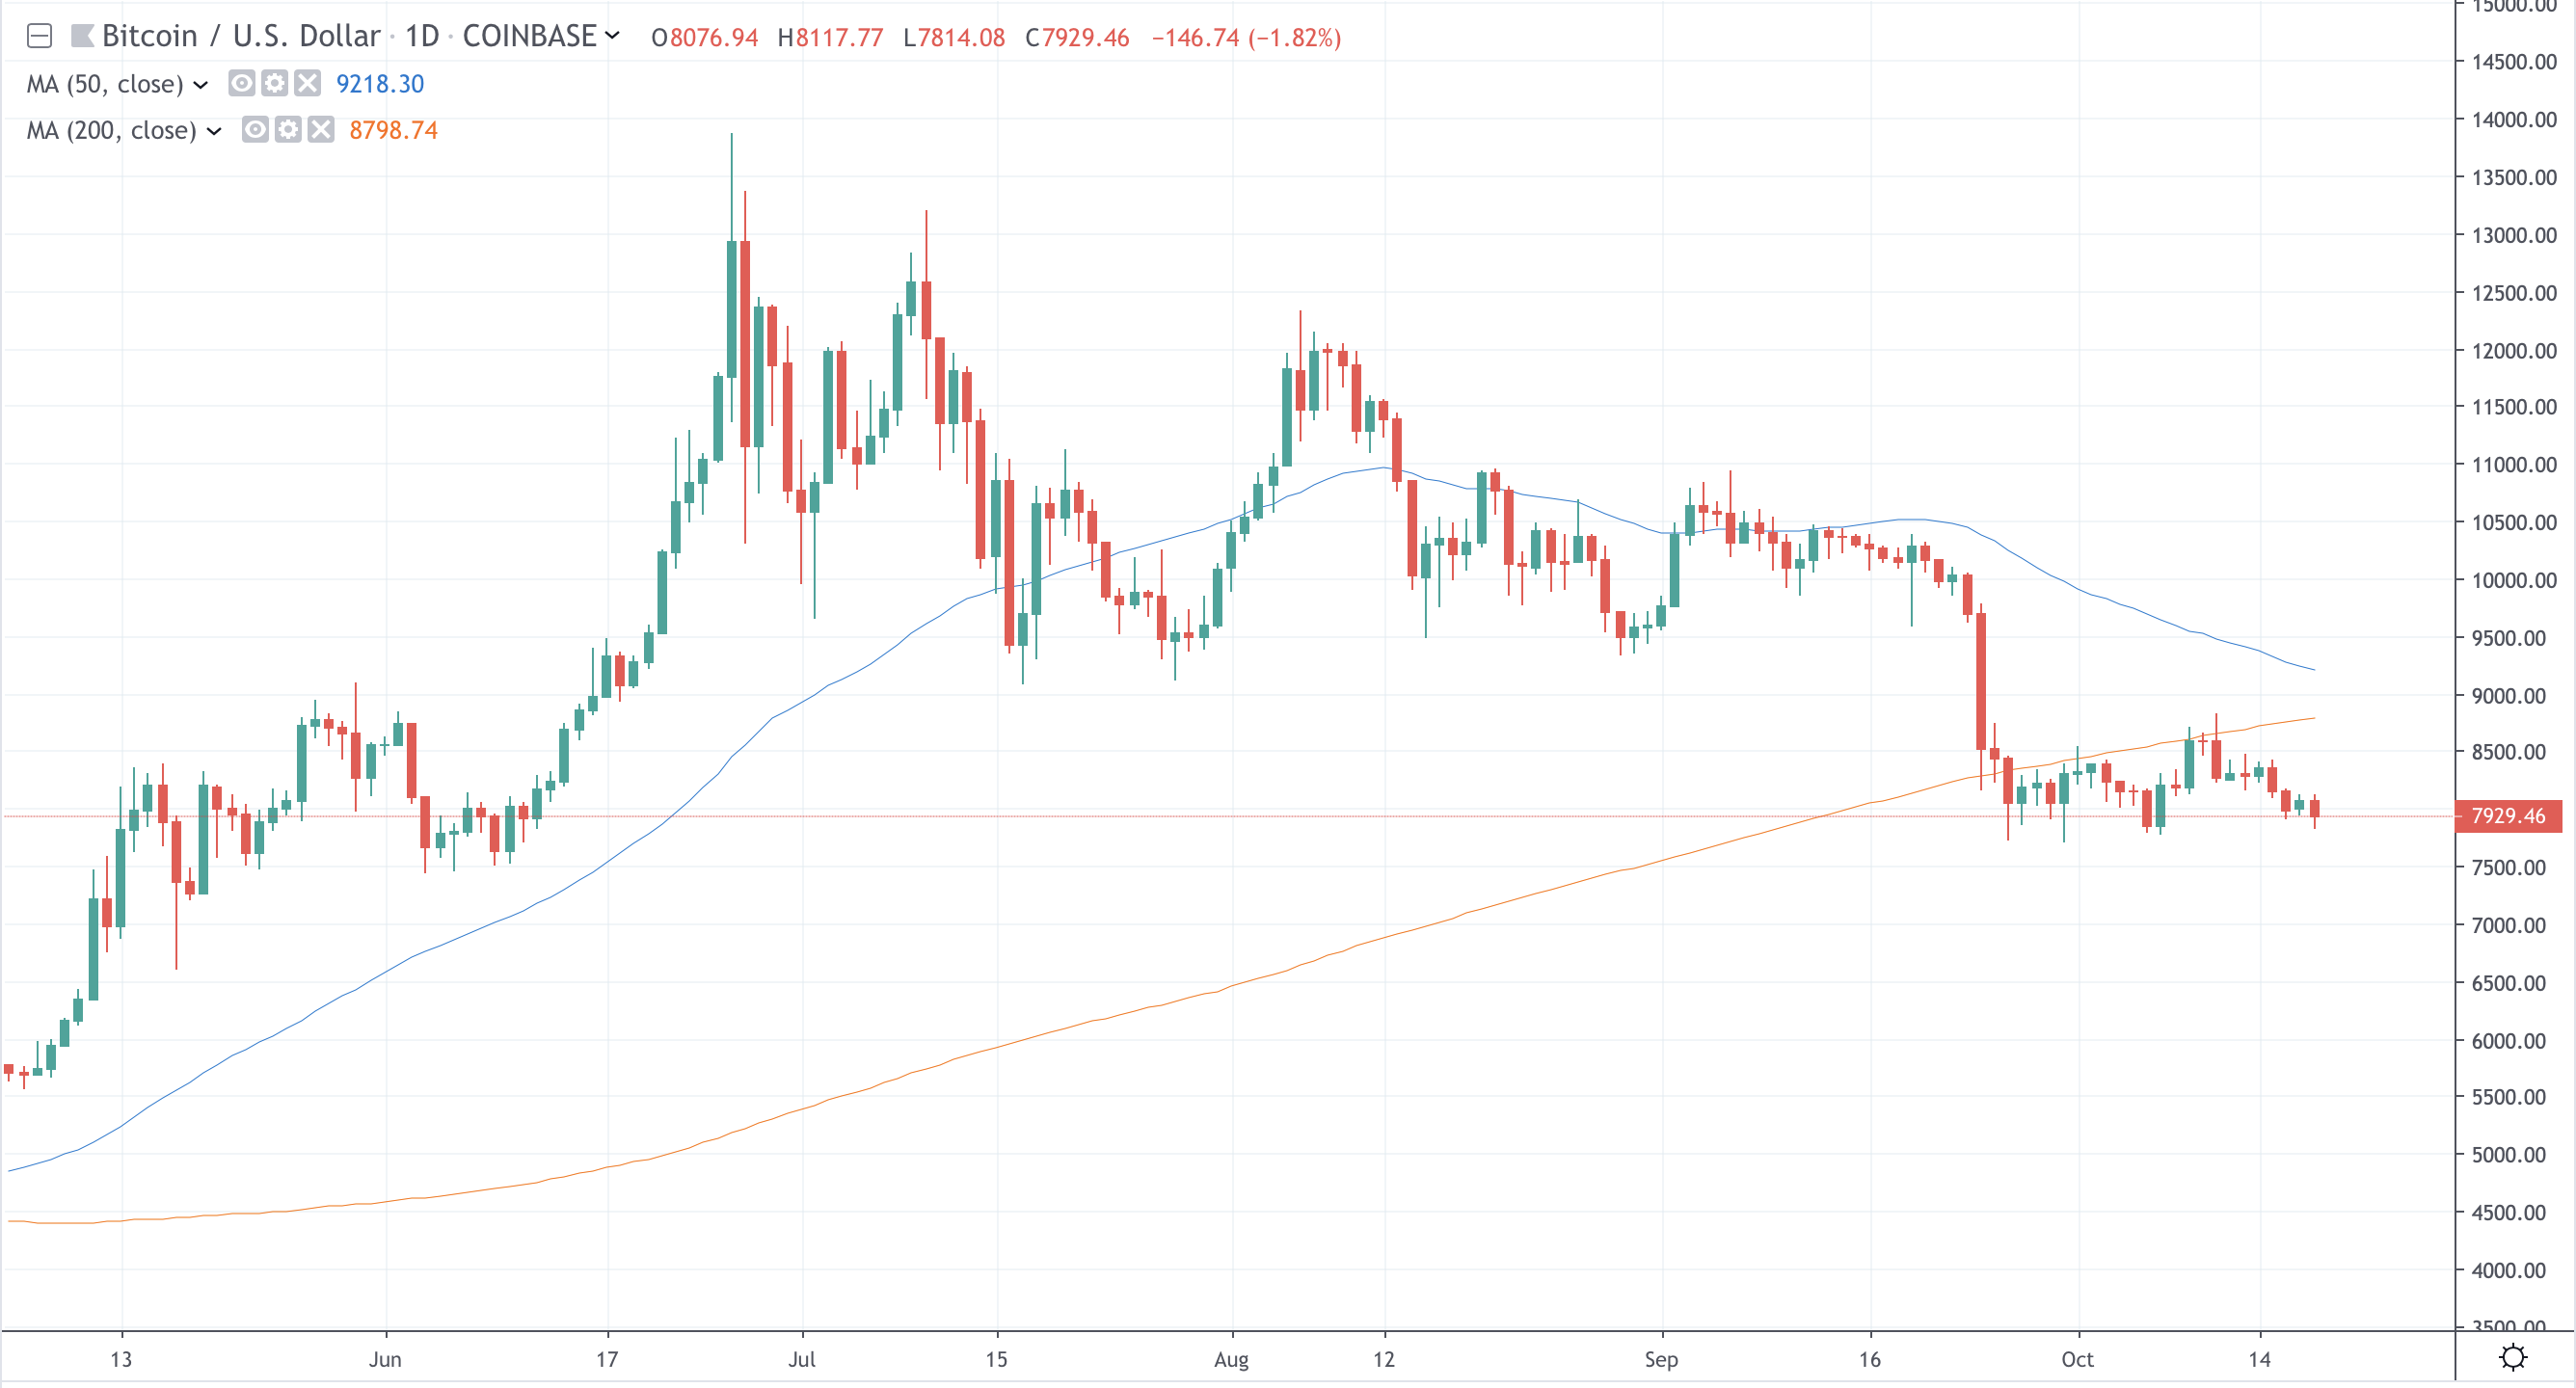
Though the peaks had had more strength this summer, this pattern was followed by a 20% fall too, subsequently entering a period of consolidation.
But there is a crucial difference with Summer 2016. This year, the triple top pattern played out over a longer time frame, pulling the 200-day average (orange line) much higher. The result is that the consolidation period is entirely occurring while below the line, which is traditionally considered the marker of a bearish attitude. With the 50-day average also going down, the death cross scenario appears likely.
Senior eToro Analyst Mati Greenspan still remains optimistic about the $7,000 level. “Bitcoin does seem to be forming some solid support on the chart just above $7,500 per coin,” he notes. “But if it does break below there are still several levels of support just below”
There could be a silver lining to all this. The last triple top pattern in late 2018, which concluded with the same sudden drop, established Bitcoin’s price bottom at $3,000. While it may not enter a new bullish phase due to the contrasting indicators, past performance seems to indicate that it won’t go much further down either.
Though it also may behave in a completely unprecedented way…. which bring us to…
Nathan Batchelor’s Daily Bitcoin Commentary
Bitcoin is back under pressure as we head into the U.S trading session, with the BTC/USD pair so far extending its decline towards the $7,800 level.
Weaker-than average Bitcoin and cryptocurrency exchange trading volumes may be the reason behind the sudden plummet in the value of the BTC/USD pair and the market in general.
From a technical perspective, failure to move past the $8,100 resistance level has kept short-term selling momentum intact, with the $7,715 level the next big support area to watch today.
Interestingly, the Choppiness Index, which measures the strength of trends, is showing that the recent bearish decline in the BTC/USD pair is diverging with the indicator.
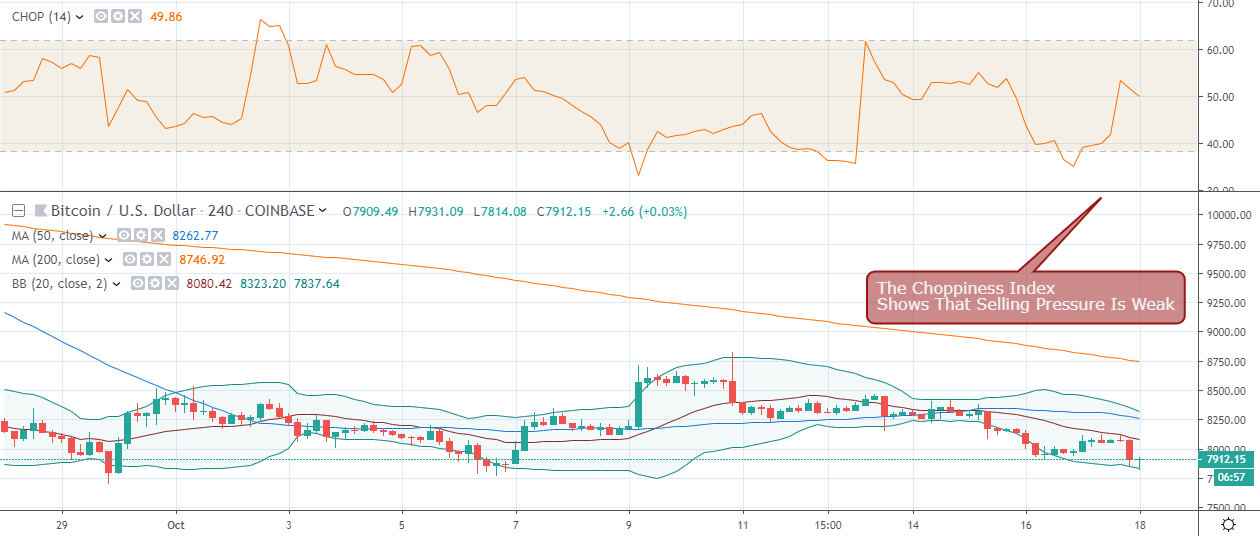
The Choppiness Index is currently generating a high-reading across the daily time frame, which suggests that the strength of the recent downmove is weak.
The same can also be said for the total market capitalization of the entire cryptocurrency market. The daily time frame is showing the Choppiness Index is still generating a high reading, despite the market eroding around $7,000,000,000,000 in value so far today.
With this in mind, failure to hold price under the $7,900 level could bring short-term buyers back into the market, while a move below the $7,715 level will likely spark a much stronger BTC/USD sell-off.
* ‘Now that the $7,900 level has been broken, the September monthly trading low is starting to come back into focus’.*
SENTIMENT
Intraday sentiment for Bitcoin is neutral, at 42.00%, according to the latest data from TheTIE.io. Long-term sentiment for the cryptocurrency is stable, at 60.00%.
UPSIDE POTENTIAL
The four-hour time frame is showing that the $8,280 level offers the strongest form of near-term technical resistance if bulls can move price past the $8,100 level today.
The daily time frame shows that key technical resistance above the current weekly trading high is located at the $8,580 and $8,810 levels.
DOWNSIDE POTENTIAL
The four-hour time frame shows the $7,715 level as the strongest form of technical support below the $7,800 level.
The daily time frame shows that the $7,330 level offers the strongest form of technical support if the $7,500 level is broken.
A full version of Nathan Batchelor’s Daily Bitcoin Commentary, together with his calls, is available to SIMETRI Research subscribers earlier in the day.