Binance Coin Price Analysis BNB / USD: Higher Highs
Binance Coin is staging an impressive rally, with incredibly bullish outlooks on all time frames.

Share this article
- Binance Coin has a bullish short-term bias, with the cryptocurrency continuing to make higher highs
- The BNB / USD pair has an increasingly bullish trading outlook over the medium-term
- The daily time frame is highlighting that a major technical breakout is underway
Binance Coin / USD Short-term price analysis
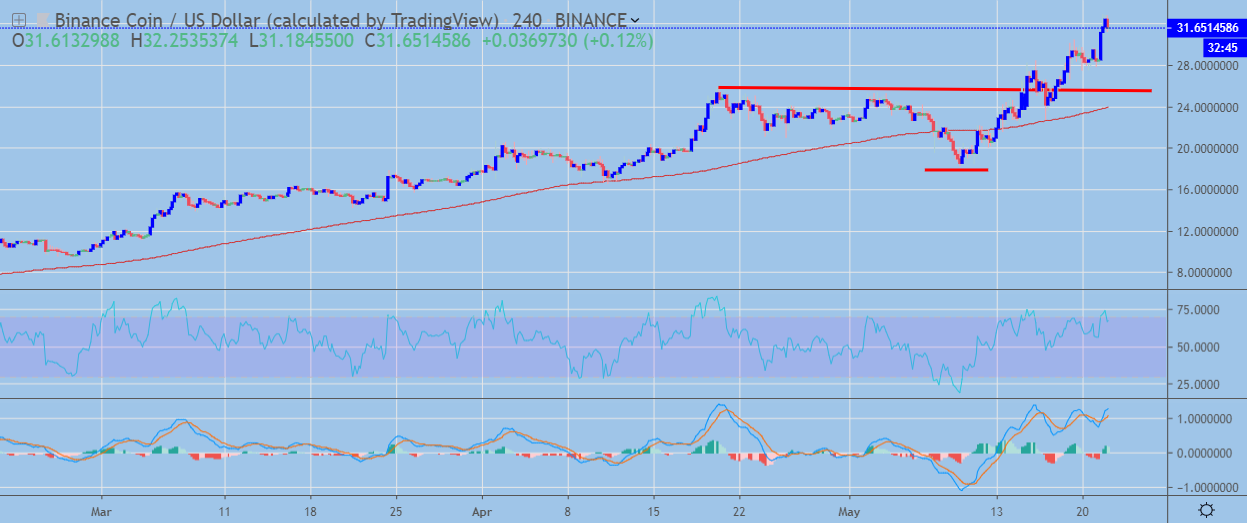
Binance Coin has a bullish short-term trading bias, with the cryptocurrency continuing to make higher price highs on the four-hour time frame.
The four-hour time frame is showing that an inverted head and shoulders pattern has been triggered, with the bullish pattern reaching its upside objective.
Technical indicators on the four-hour time frame are still bullish, although they appear extremely overstretched.
 BNB / USD H4 Chart by TradingView
Pattern Watch
Traders should expect further upside in the BNB / USD pair while price trades above the neckline of the bullish pattern.
Relative Strength Index
The RSI Indicator is also bullish on the four-hour time frame, although it is currently extremely overbought.
MACD Indicator
The MACD indicator on the four-hour time frame is bullish, although both the MACD histogram and signal line currently appear overstretched.
Binance Coin / USD Medium-term price analysis
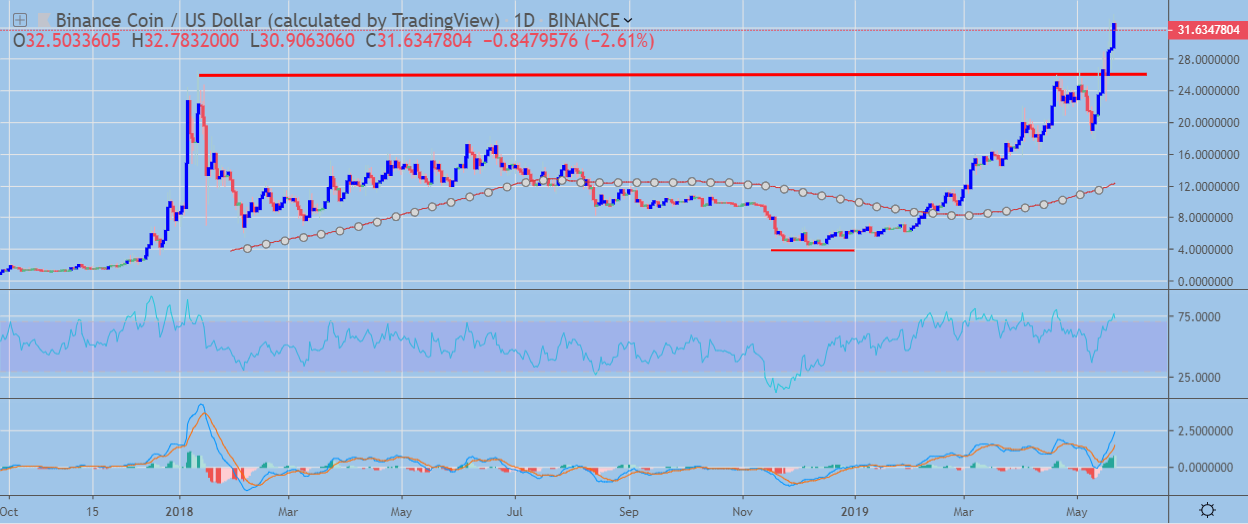
Binance Coin has an increasingly bullish medium-term outlook, with the cryptocurrency performing a major technical breakout on the daily time frame.
The daily time frame is showing that bulls have triggered an inverted head and shoulders pattern, with the bullish pattern holding a sizeable upside projection.
Technical indicators are bullish on the daily time frame and continue to offer a strong buy signal.
 BNB / USD Daily Chart by TradingView
Pattern Watch
Traders should note that the BNB / USD pair has significant scope to rally to the upside while price trades above the neckline of the bullish inverted head and shoulders pattern.
Relative Strength Index
The RSI indicator is bullish on the daily time frame, although it is approaching overbought conditions.
MACD Indicator
The MACD indicator on the daily time frame is bullish and continues to issue a buy signal.
Conclusion
Binance Coin has staged a major technical breakout, with the bullish pattern on the daily time frame highlighting that BNB / USD pair can still trade substantially higher over the medium-term horizon.
Check out our coin guide for BNB to understand how it works.
We also conducted a deep analysis of the Binance Exchange token in our DARE.
Share this article
