Chainlink Price Analysis LINK / USD: Bears Leading The Way
Sellers are in control of LINK's price.

Share this article
- Chainlink has a bearish short-term bias, with the LINK / USD pair falling below critical technical support on the four-hour time frame
- The four-hour time is now showing that a bearish breakout from a wedge pattern is currently underway
- The daily time frame is showing that the LINK / USD has fallen below its key 50-day moving average
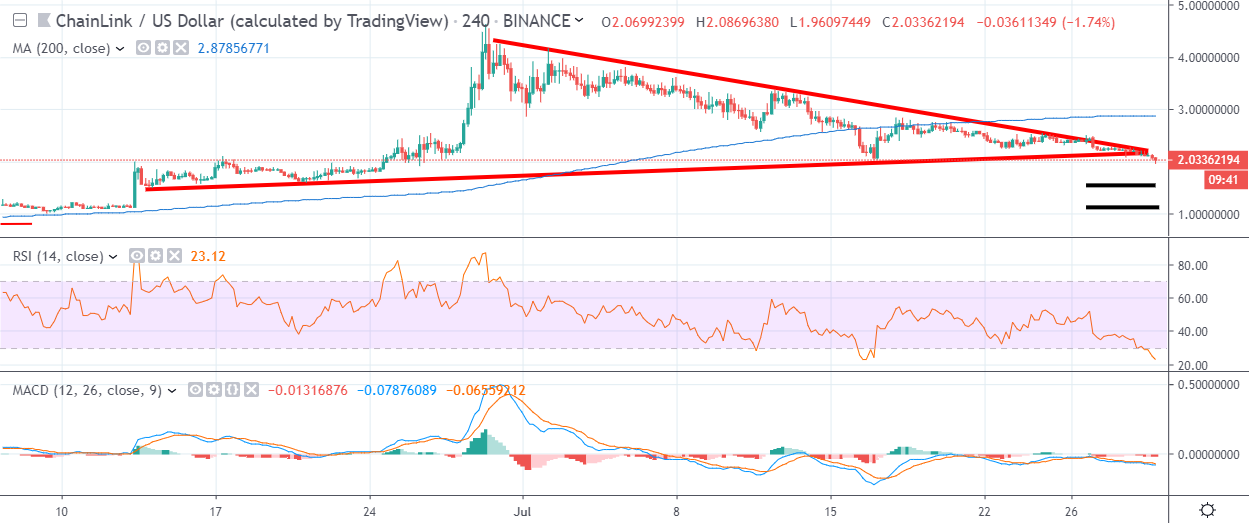
Chainlink / USD Short-term price analysis
Chainlink has a bearish short-term trading bias, with the cryptocurrency starting to weaken below critical support on the four-hour time frame.
The four-hour time frame is now showing that bearish breakout from a well-defined wedge pattern is currently underway, following numerous failed attempts to overcome trendline resistance.
Technical indicators on the four-hour time frame are bearish and continue to issue strong sell signals.
Pattern Watch
Traders should note that the bearish wedge breakout could reach the June 13th swing-low.
Relative Strength Index
The RSI indicator on the four-hour time frame is heavily bearish, although it has now reached oversold territory.
MACD Indicator
The MACD indicator on the four-hour time frame is bearish and continues to issue a sell signal.
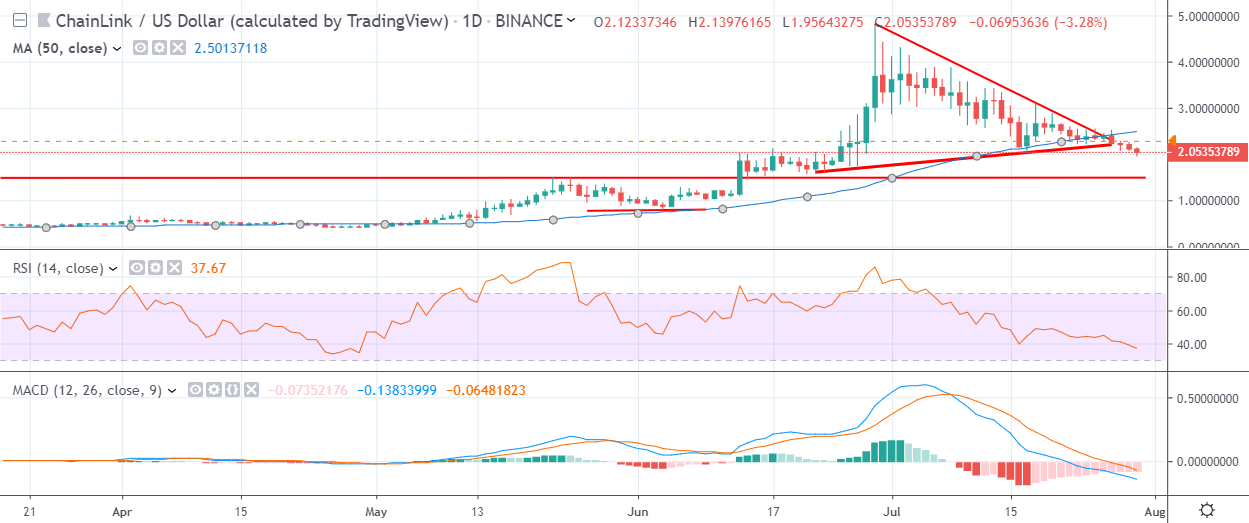
Chainlink / USD Medium-term price analysis
The LINK / USD has a bearish medium-term trading bias, with the cryptocurrency weakening below its 50-day moving average for the first time since April 2019.
The daily time frame is showing that the LINK / USD pair is starting to breakout from a neutral triangle pattern. Sellers may start to target the neckline of a large inverted head and shoulders pattern on the mentioned time frame.
Technical indicators on the daily time frame are bearish and continue to issue strong sell signals.
Pattern Watch
Traders should note that the June 2019 swing-low offers the foremost technical support below the neckline of the large inverted head and shoulders pattern.
Relative Strength Index
The RSI indicator on the daily time frame is bearish and continues to issue a strong sell signal.
MACD Indicator
The MACD indicator on the daily time frame is bearish, with both the MACD signal line and MACD histogram issuing strong sell signals.
Conclusion
Chainlink has an increasingly bearish bias across both time horizons and risks reversing an even greater portion of its recent trading gains.
The recent weakening below the LINK / USD pair’s 50-day moving average also suggests that medium-term sellers are now in control of the cryptocurrency.
Find out more about Chainlink in our coin guide.
Share this article
