Chainlink Price Analysis LINK / USD: Trying To Emerge
Encouraging signs for LINK traders.

Share this article
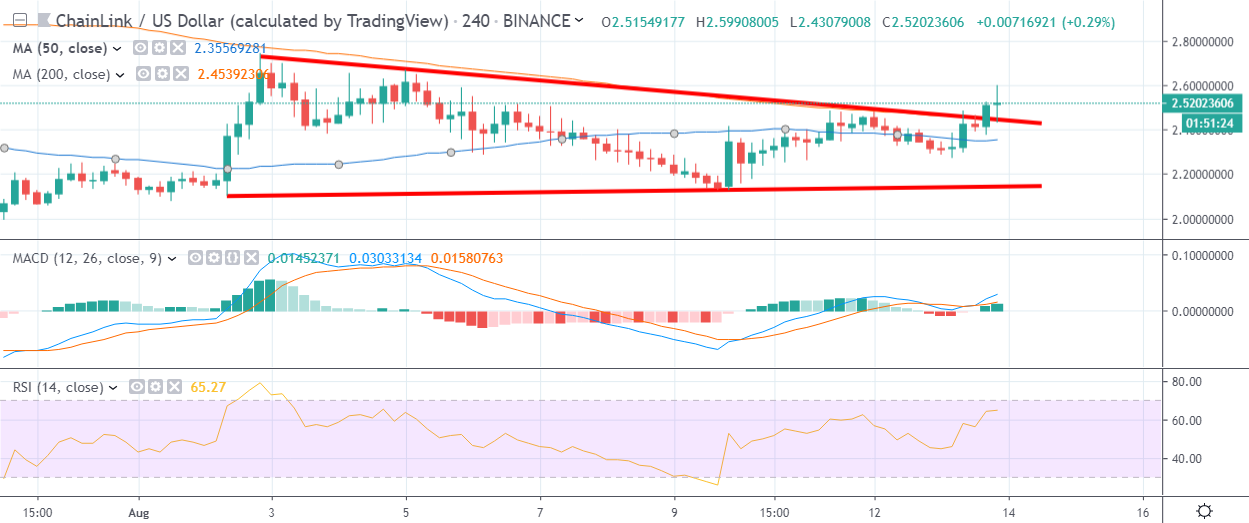
- Chainlink has a bullish short-term bias, with the LINK / USD pair recovering above its 200-period moving average on the four-hour time frame
- The four-hour time is now showing that a bullish breakout from a descending triangle pattern is currently underway
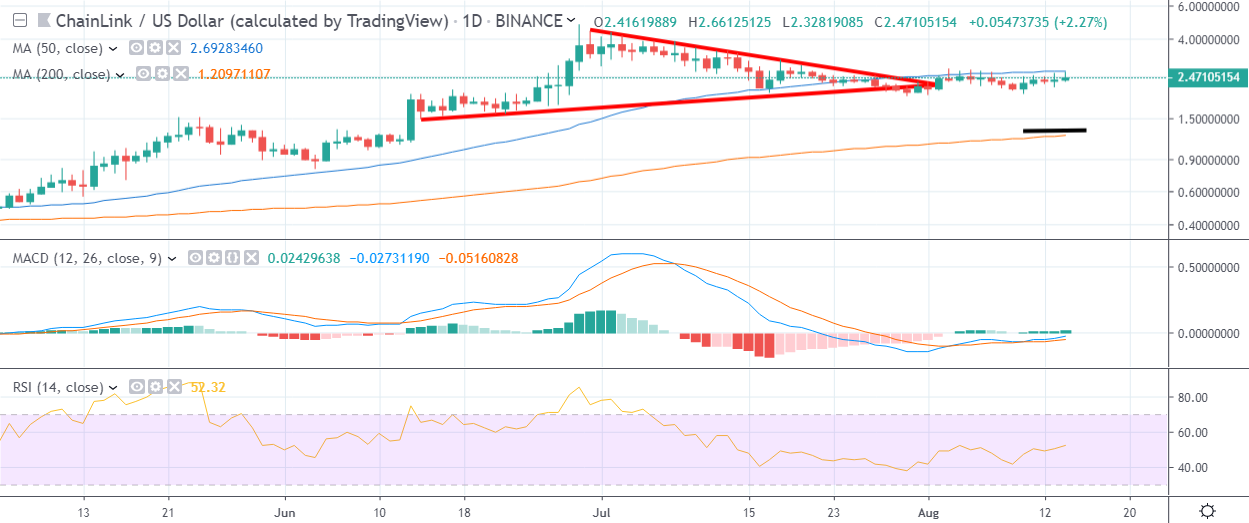
- The daily time frame is showing that the LINK / USD pair is struggling to move above its 200-day moving average
Chainlink / USD Short-term price analysis
Chainlink has a bullish short-term trading bias, with the cryptocurrency rallying above its 200-period on the four-hour time frame.
The four-hour time frame is now showing that a bullish breakout from a descending triangle pattern is currently underway, placing the current monthly trading back into focus.
Technical indicators on the four-hour time frame are bullish and continue to issue buy signals.
Pattern Watch
Traders should note that a bullish inverted head and shoulders pattern could start to form.
Relative Strength Index
The RSI indicator on the four-hour time frame is bullish and continue to issue a buy signal.
MACD Indicator
The MACD indicator on the four-hour time frame is bullish and continues to issue a buy signal.
Chainlink / USD Medium-term price analysis
The LINK / USD has a bearish medium-term trading bias, with the cryptocurrency struggling to overcome its key 200-day moving average.
The daily time frame is showing that bullish momentum is starting to fade, following the LINK / USD pair’s recent technical breakout from a neutral triangle pattern.
Technical indicators on the daily time frame are mixed and are currently failing to issue clear trading signals.
Pattern Watch
Traders should note that failure to overcome the 200-day moving average make provoke a decline back towards the LINK / USD pair’s 50-day moving average.
Relative Strength Index
The RSI indicator on the daily time frame is starting to recover above neutral territory.
MACD Indicator
The MACD indicator on the daily time frame is rising, although the bullish signal is still weak.
Conclusion
The recent breakout on the four-hour time frame is encouraging for LINK / USD bulls and could potentially signal an upcoming technical test of the current monthly trading high.
Medium-term buyers need to start to rally the cryptocurrency above its 200-day moving average or bears may start to take back control of price action.
Find out more about Chainlink in our coin guide.
Share this article
