Chainlink Price Analysis LINK / USD: Steady Advance
Link continues its upside movement.

Share this article
- Chainlink has turned bullish over the short and the medium-term
- The four-hour time frame shows that a potential inverted head and shoulders could be forming
- The lower time frame shows bearish MACD price divergence
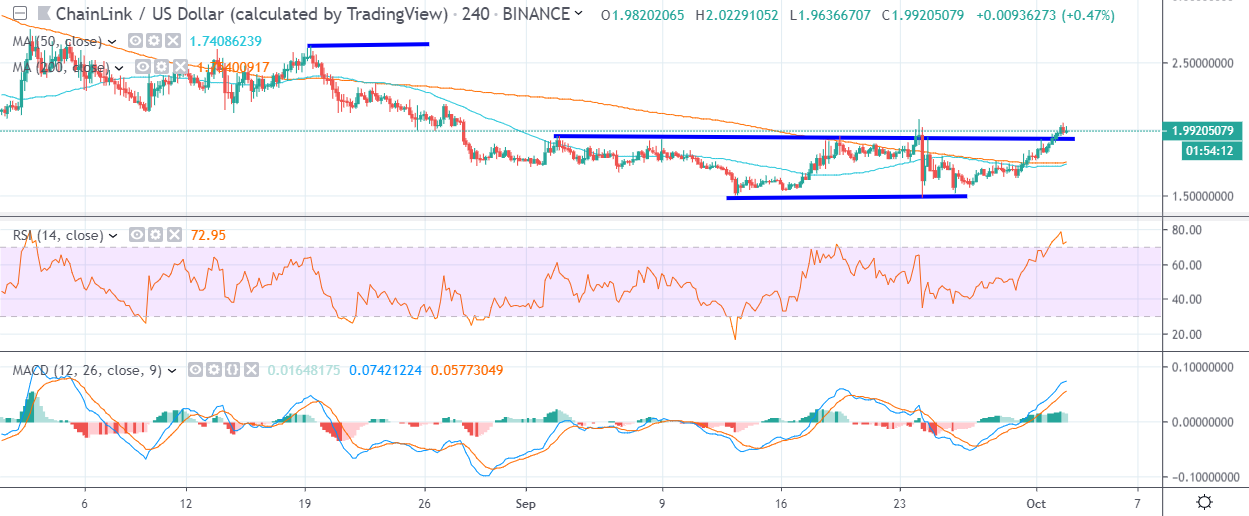
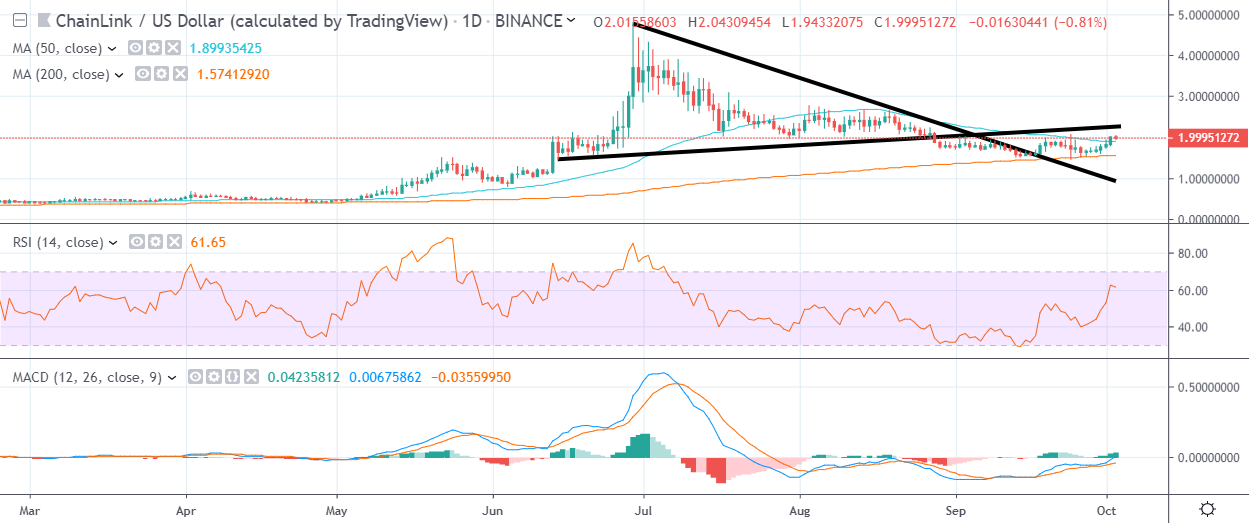
Chainlink is continuing its early-month rally, with the cryptocurrency fully eroding its September trading losses. The LINK / USD pair is also one of the few cryptocurrencies in the top twenty by market cap that is trading above its key 200-day moving average.
In percentage terms the LINK / USD pair has gained close to thirteen percent since the start of the new trading month and has recovered over thirty percent of its value from the worst levels of September.
The cryptocurrency has also turned bullish over the short-term, with the recent rally helping to form an inverted head and shoulder pattern. The $1.93 level is currently the neckline of the bullish inverted head, with the $2.40 level the overall upside objective.
Bulls are currently attempting to break above the September trading high, which would help to negate a potential double-top price pattern, which is located around the $2.06 level.
The lower time frames are also showing bearish MACD price divergence, which suggests that the LINK / USD pair could see a short-term pullback if buyers fail to breach the September monthly trading high. The bearish price divergence extends towards the $1.77 level, which is also the September monthly price open.
Medium-term analysis shows major trendline resistance around the $2.22 level, which may come into focus if the September 24th trading high is broken. A breakout above the trendline could see the LINK / USD pair soaring in value.
The RSI indicator on the four-hour time frame is currently overbought, while the daily time frame shows that the RSI indicator and the MACD indicator have considerable scope to advance before becoming overbought.
According to the latest sentiment data from TheTIE.io, the short-term sentiment towards Chainlink is neutral, at 48.00 %, while the overall long-term sentiment towards the cryptocurrency is bullish overwhelmingly bullish, at 68.50%.
Upside Potential
The four-hour time frame highlights that the LINK / USD pair has turned bullish over the short-term, with its 200-period moving average converging with the 50-period moving average around the $1.75 level.
Key upside resistance above the $2.06 level is currently located at the $2.22 and $2.40 levels, with the $2.60 level the strongest form of medium-term resistance above.
Downside Potential
The LINK / USD pair currently shows bearish MACD price divergence across the lower time frames, which extends down towards the $1.77 support level.
The cryptocurrency’s 50-day moving average is currently located around the $1.93 level, while the LINK / USD pair’s 200-day offers critical medium-term support, around the $1.55 level.
Summary
Chainlink is continuing its recent recovery, with the cryptocurrency turning bullish over the short and medium-term and challenging its former monthly trading high.
A breach of the September trading high could see the LINK / USD pair rally towards at least the $2.22 level, while technical failure could prompt technical selling towards the $1.77 support level.
Find out more about Chainlink in our coin guide.
Share this article
