
Chainlink Price Analysis LINK / USD: Linking With Google
A massive integration announcement is driving price.
- Chainlink has a bullish short-term bias, with the LINK / USD breaking out to new all-time price high
- The four-hour time frame is now showing that a bullish inverted head and shoulders pattern has been ignited
- The daily time frame is showing a large bullish pattern with scope for further upside
Fundamental Analysis
LINK has surged after the integration announcement with Google. The company is planning to allow Ethereum app builders that use Google’s software to integrate decentralized oracles using Chainlink. After the launch of the mainnet, Chainlink has been expanding its network of partners, which has helped the token build positive momentum.
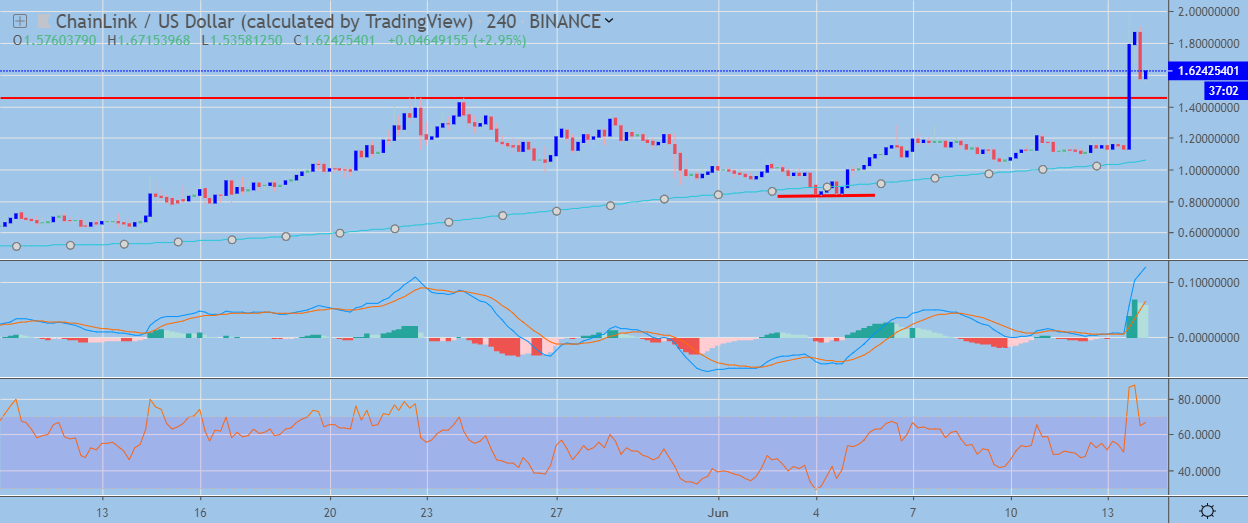
Chainlink / USD Short-term price analysis
Chainlink has a bullish short-term trading bias, with the cryptocurrency staging a breakout rally to a new all-time record price-high.
The four-hour time frame is now showing that a bullish inverted head and shoulders pattern has been ignited, with the LINK / USD pair currently retracing back towards neckline support.
Technical indicators on the four-hour time frame are starting to appear overstretched to the upside.
Pattern Watch
Traders should note that the bullish pattern on the four-hour time frame has so far failed to reach its overall upside objective.
Relative Strength Index
The RSI indicator on the four-hour time frame is still undergoing a correction from extreme overbought conditions.
MACD Indicator
The MACD indicator on the four-hour time frame is bullish although it is starting to appear overstretched.
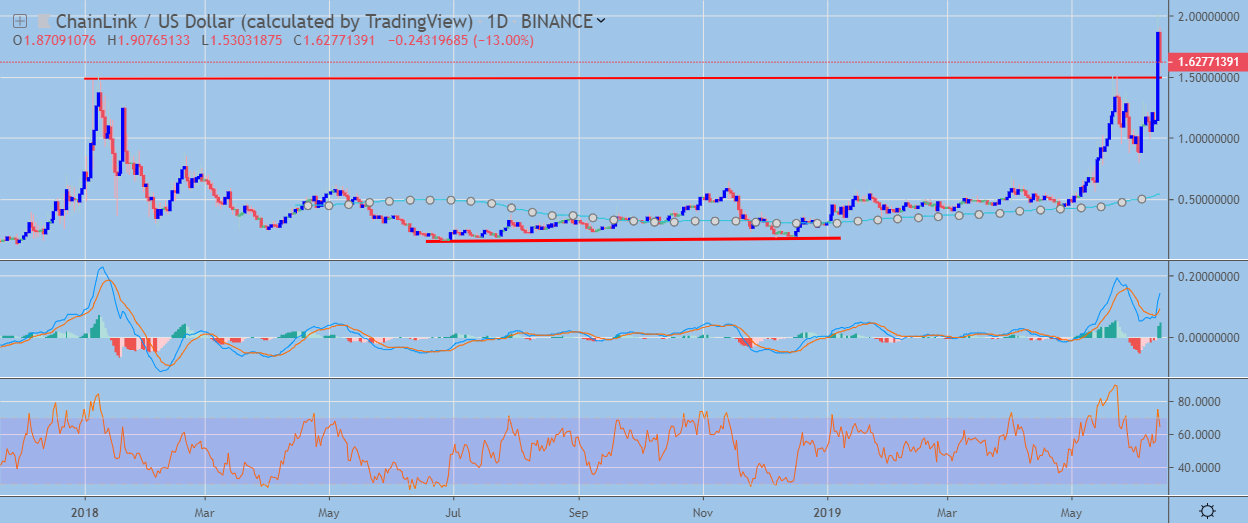
Chainlink / USD Medium-term price analysis
The LINK / USD has an increasingly bullish medium-term trading outlook, with the cryptocurrency performing a major technical breakout on the daily time frame.
The daily time frame is showing that the LINK / USD pair has now moved above the neckline of an extremely large inverted head and shoulders pattern.
Technical indicators on the daily time frame have turned bullish alongside the recent move higher.
Pattern Watch
Traders should note that the upside objective of the bullish pattern would nearly double the value of the LINK / USD pair.
Relative Strength Index
The RSI indicator on the daily time frame remains bullish, although it is failing to make a new high alongside price.
MACD Indicator
The MACD indicator on the daily time frame is bullish, with both the MACD signal line and MACD histogram issuing buy signals.
Conclusion
Chainlink has staged a major breakout rally on both time frames, with the LINK / USD pair surging to a fresh all-time record price high.
The bullish pattern on the daily time frame is suggesting that if the bullish breakout is genuine the cryptocurrency could nearly double in value from current levels.
What do oracles have to do with crypto? Find out in the Chainlink coin guide.