 Earn with Nexo
This article has been updated with additional analysis.
Crypto Market Continues Recovery As IOTA and ICON Surge
Market recovers while ICON benefits from an exchange quirk.
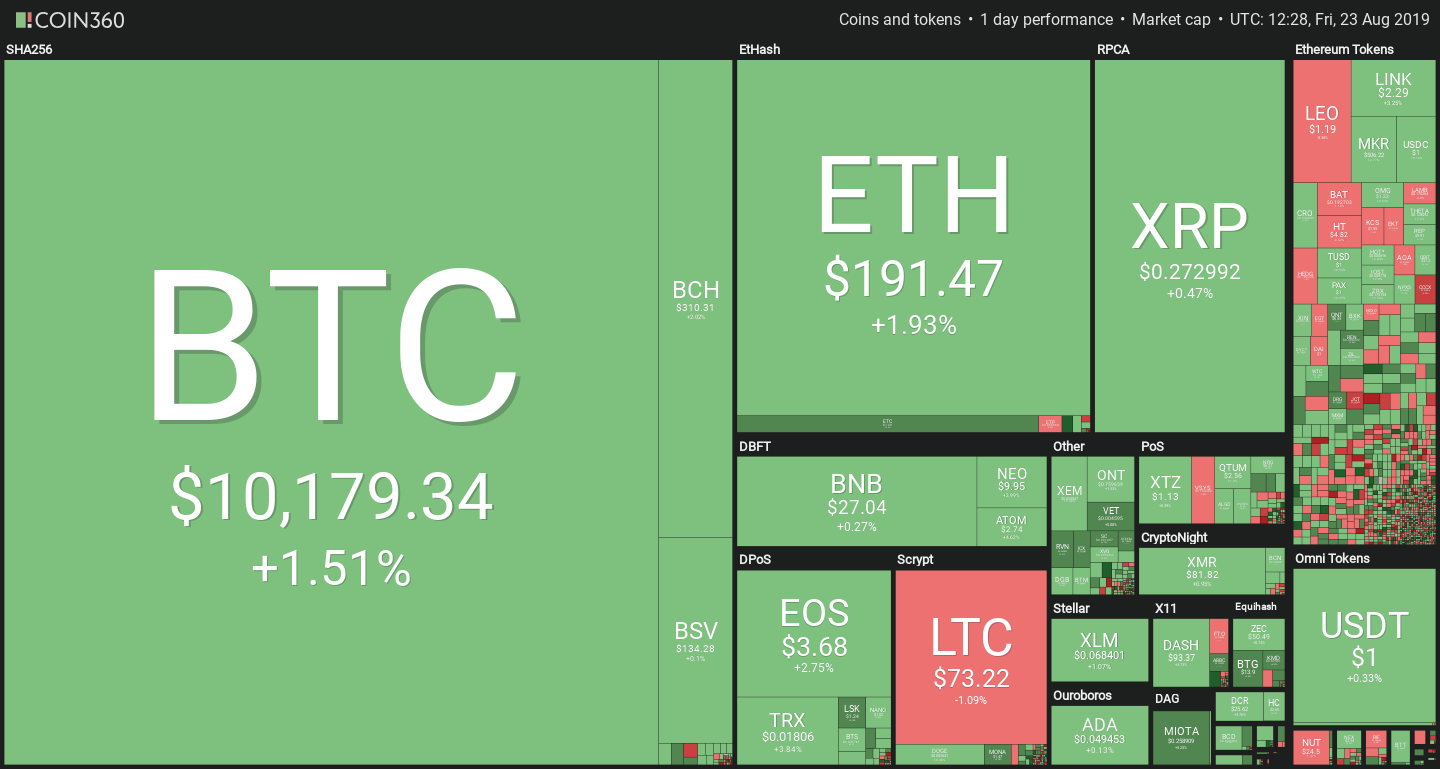
The altcoin action continues today as the majority of the market is in the green. Meanwhile, Bitcoin has stabilized over $10,000 while continuing to lose some of its dominance.
Nevertheless, good news keep coming for Bitcoin – this time from Albion. In a landmark decision, the British law firm Stewarts managed to obtain an Asset Preservation Order (APO) for its client. While the matter is still far from being completely settled, this is the first time that Bitcoin is treated as property in British court, which previously struggled with its classification: the law allows for only two types of property, chose in possession and chose in action. The first refers to possession of strictly physical things, while the second pertains to property rights that can be enforced through legal action i.e. money in a bank account. Bitcoin doesn’t fit any of the two rigid definitions, which caused a great deal of uncertainty in court.
Good day for the letter I
The altcoin market is seeing a stable recovery, though most coins in the top-10 only have modest gains comparable to BTC.
The exception is provided by two I tokens: IOTA and ICON.
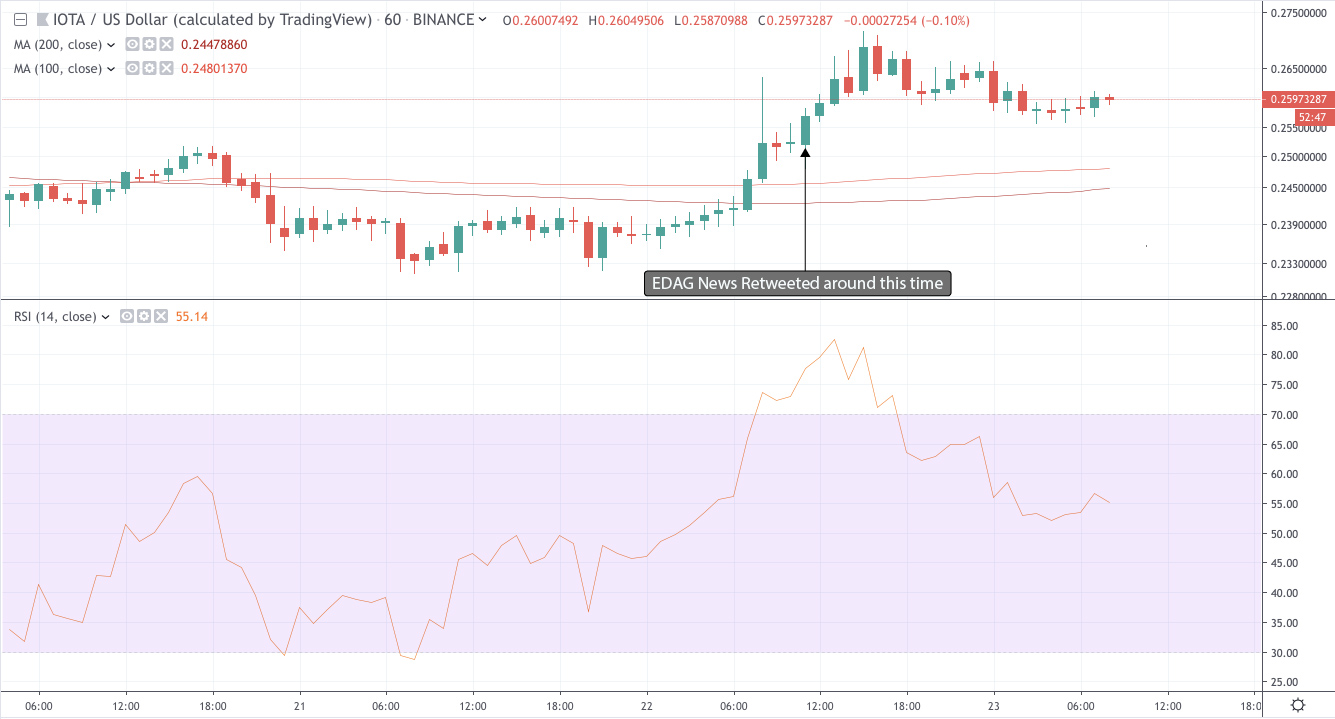
IOTA has already retraced some of its gains, but remains at +4.86% on the day, a solid increase in the context of the market.
The rise can be attributed to a tweet by Alexander Renz, subsequently retweeted by IOTA’s twitter account, which announced the upcoming presentation of EDAG Engineering’s CityBot, an IOTA-powered autonomous vehicle concept.
#EDAG to present #CityBot at #IAA – a multi-functional robotic vehicles with @iotatoken based feeless machine-to -machine micro-payments. Machines as their own economic agents in the next gen web! #IOTA #DLT #Blockchain https://t.co/f1uzXt17qp
— Alexander Renz (@AlexanderRenz) August 22, 2019
The tweet coincided with a 6% spike in IOTA / USD which added to an already good performance that day.
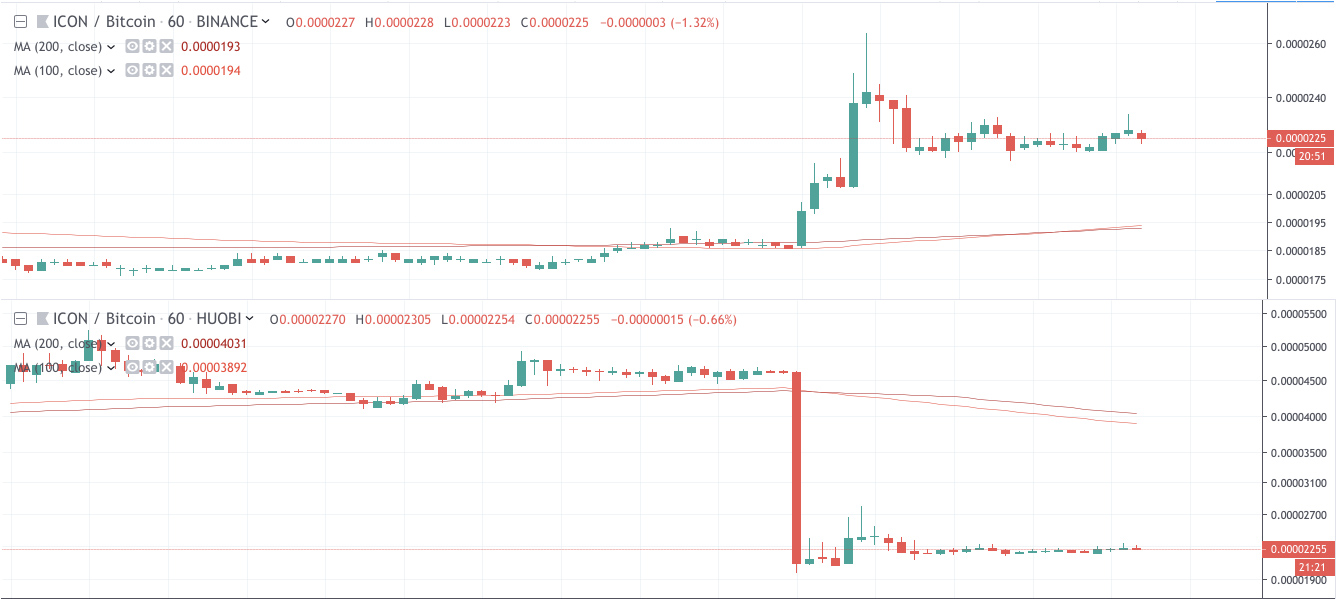
The biggest winner today in the (almost) top-50 is definitely ICON, with a 10% increase over the last 24 hours.
The explanation is however very simple. ICX used to trade at a more than 100% premium on Huobi, whose price was then excluded from CMC calculations. Yesterday, the floodgates were opened, and arbitrage traders on Binance rushed to buy the coin to then sell it on Huobi. In the process, the price reached a new, slightly higher equilibrium.
Technical Analysis: Nathan Batchelor on Bitcoin
Bitcoin is creeping higher as we move into in the U.S session, with the $10,300 level as the key technical area where bulls and bears will tussle for intraday control. As I noted yesterday, the recent move higher in Bitcoin’s overall market dominance had created some negative MACD price divergence, which is starting to unravel.
It appears that rather than Bitcoin declining in value as the negative divergence unwinds, we are seeing the broader market outpacing the number one cryptocurrency in terms of gains. This may be a very short-term trend while Bitcoin’s overall market dominance slides back towards the 67 percent level, as the charts suggest.
I think that the key moving averages on the daily time frame are helping to simplify the short-term picture for Bitcoin, particularly as we trade reasonably close to the BTC/USD pair’s 100-day moving average.
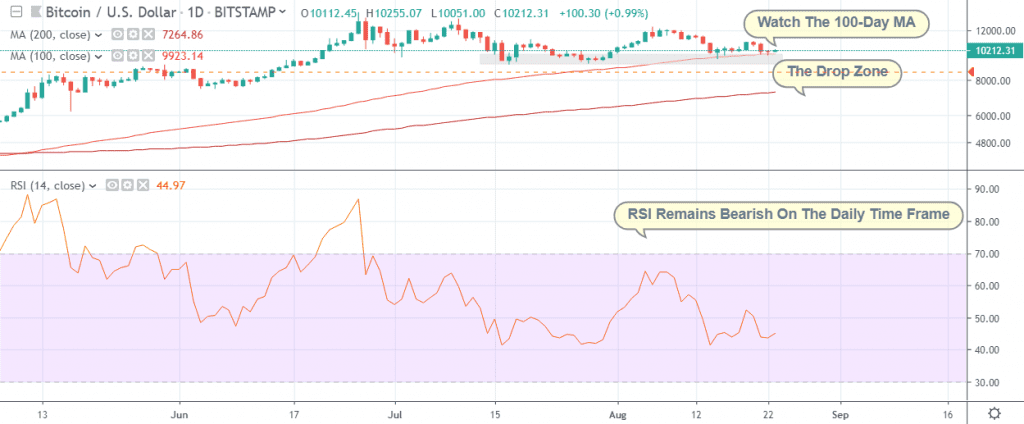
Prices have not closed below Bitcoin’s 100-day moving average since mid-February this year, although it briefly dipped below last Thursday.
The 100-day moving average is currently found at the $9,900 level. If we see multiple daily price closes below this key technical metric we should expect a down move towards at least the $9,450 level, although the $9,100 level is more technically important at this stage.
Once below the $9,100 level, Bitcoin’s 200-day moving average is located way down, at the $7,100 level. This further underscores the importance of the $9,100 level if we do crack below the 100-day moving average over the coming sessions.
*The $10,550 to $10,600 levels are top-end near-term resistance, while the $9,900 level is now becoming a key area bulls need to defend to stop a much deeper decline.*
SENTIMENT
Intraday bullish sentiment for Bitcoin is still pretty weak, at 47.00%, according to data from TheTIE.io – while the long-term sentiment indicator has increased, at 70.10% positive.
The recent fears of a brewing global recession could have a negative impact on bitcoin and overall sentiment. If there is a “severe” financial crisis, its likely that investors will turn away from cryptocurrencies and start choosing safer assets in order to protect their wealth.
UPSIDE POTENTIAL
Short-term bulls have so far staged a very weak recovery, with the most recent intraday high located around the $10,260 level. Any moves above this area can expect strong technical resistance from the $10,380 level and more formidable Fibonacci resistance from the $10,550 level.
The daily time frame is showing that Bitcoin’s 50-day moving average is around the $10,700 level. We must also remember that any moves back above the $10,600 level would completely erode the quick 500 point drop we saw on Wednesday.
DOWNSIDE POTENTIAL
As I previously mentioned, the daily moving averages are currently helping to smooth the overall technical picture, with Bitcoin appearing somewhat stuck-in-the-mud around the $10,200 level at present.
All the lower time frame moving averages are currently telling the same story, in that Bitcoin has almost non-existent short-term technical support below the $10,050 level. So for now, all eyes are on the 100-day moving average, at $9,900, for either a sharp decline or a solid bounce.
Disclosure: This article was edited by Andrey Shevchenko. For more information on how we create and review content, see our Editorial Policy.