
Decred Price Analysis DCR / USD: Relying On Miracles
Can prayers affect token prices? Only one way to find out.

Share this article
- Decred has a bearish short-term outlook, with price remaining below key resistance on the four-hour time frame
- The four-hour time frame shows that a bearish head and shoulder pattern has been triggered
- The daily time frame highlights that the DCR / USD pair remains in correction
Decred / USD Short-term price analysis
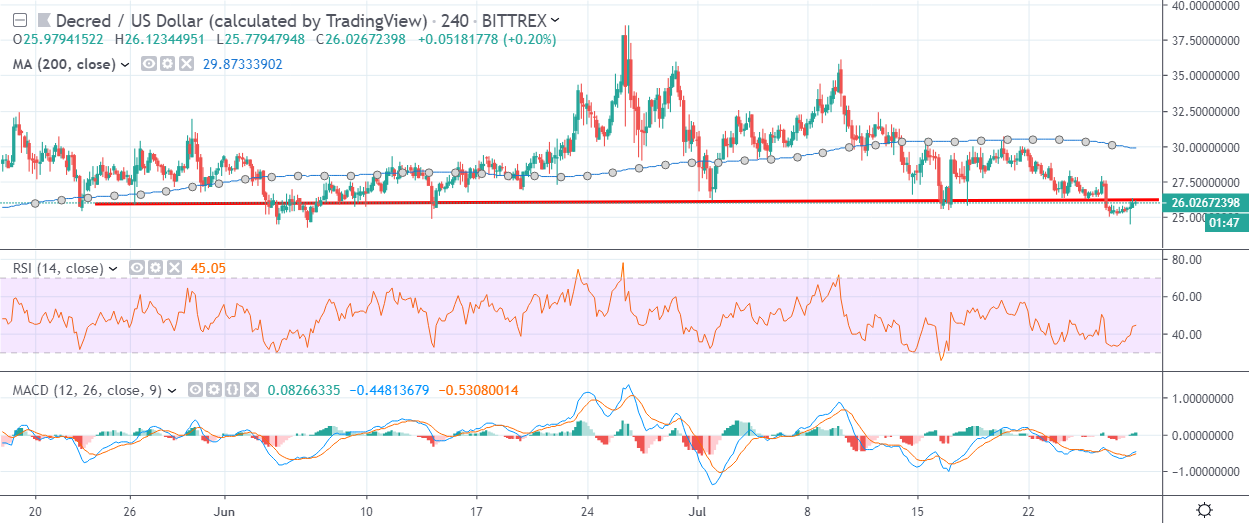
Decred has a bearish short-term outlook, with the cryptocurrency trading below critical resistance on the four-hour time frame.
The four-hour time frame shows that a bearish head and shoulders pattern has been triggered, with the DCR / USD pair trading below key neckline resistance.
Technical indicators are mixed across the four-hour time frame and are currently failing to generate a clear trading signal.
Pattern Watch
Traders should note that the DCR / USD pair could see substantial losses if the head and shoulders pattern on the four-hour time frame reaches its full downside potential.
Relative Strength Index
The Relative Strength indicator is attempting to correct higher on the four-hour time frame, although it remains technically bearish.
MACD Indicator
The MACD indicator is starting to turn bullish on the four-hour time frame, although the buy signal is still fairly weak.
Decred / USD Medium-term price analysis
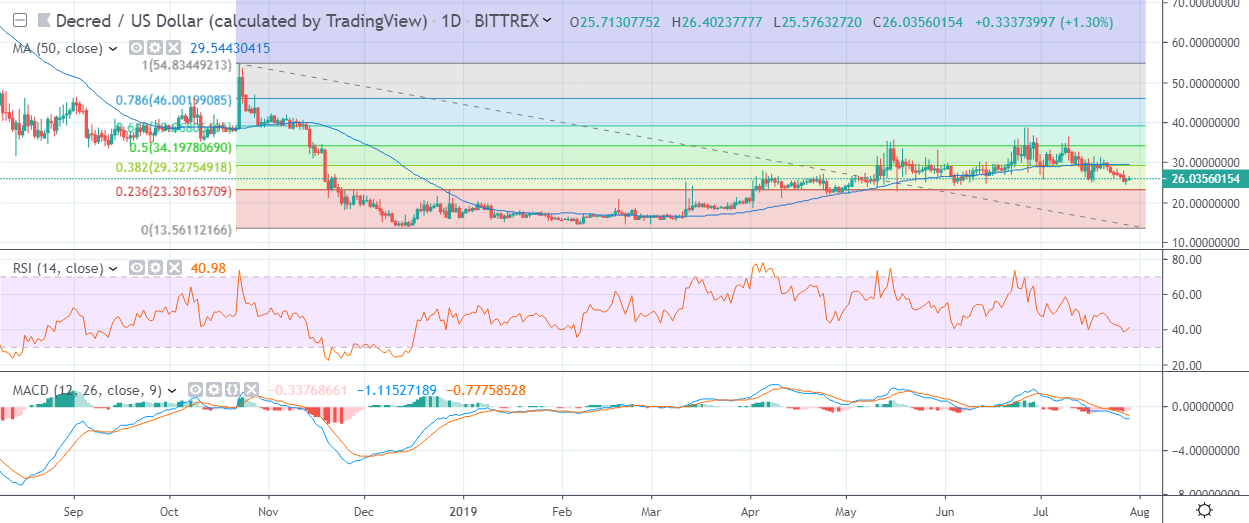
Decred has a bearish medium-term outlook, with the cryptocurrency repeatedly unable to recover the heavy losses incurred during late 2018.
The daily time frame shows that the 61.8 percent Fibonacci retracement of the October 23rd swing-high to the December 2018 trading low has continued to cap any meaningful recoveries in the DCR / USD pair.
Technical indicators are resoundingly bearish on the daily time frame and continue to issue sell signals.
Pattern Watch
With the absence of any bullish pattern the DCR / USD pair may continue to drift lower over the medium-term.

Relative Strength Index
The RSI indicator remains bearish on the daily time frame and continues to highlight growing bearish pressure over the medium-term.
MACD Indicator
The MACD indicator is bearish on the daily time frame and continues to issue a sell signal.
Conclusion
Decred is likely to come under increasing downside pressure over the short-term while price continues to trade below neckline resistance.
With the absence of any bullish patterns on the daily time frame the cryptocurrency needs a positive fundamental catalyst to change the increasingly bearish medium-term picture.
What is the Decred project all about? Find out in our coin guide.
The Simetri team has also published a deep overview in the Decred DARE.
Share this article
