
Despite Infura Crash, Ethereum Leads Bitcoin, XRP to Higher Highs
Following a week-long consolidation period, Ethereum seems to be the first top three cryptocurrency to break out.
Bitcoin, Ethereum, and XRP sit at a pivotal point as billionaires flock to the cryptocurrency industry. While buying pressure mounts, these cryptocurrencies could be about to rise to higher highs.
Bitcoin Awaits for Volatility to Strike Back
The bellwether cryptocurrency has endured a week-long consolidation phase that forced the Bollinger bands to squeeze on its 4-hour chart. This technical index’s contractions indicate low volatility periods, which are usually succeeded by significant price movements. This is especially true when trends prolong for an extended period as it is happening at the moment.
Although the Bollinger bands forecast that the pioneer cryptocurrency is about to breakout, it fails to provide a clear path for its trend. Such failure makes the area between the lower and upper band a reasonable no-trade zone.
Only a 4-hour candlestick close below $14,850 support or above the $15,760 resistance will determine where BTC is headed next.
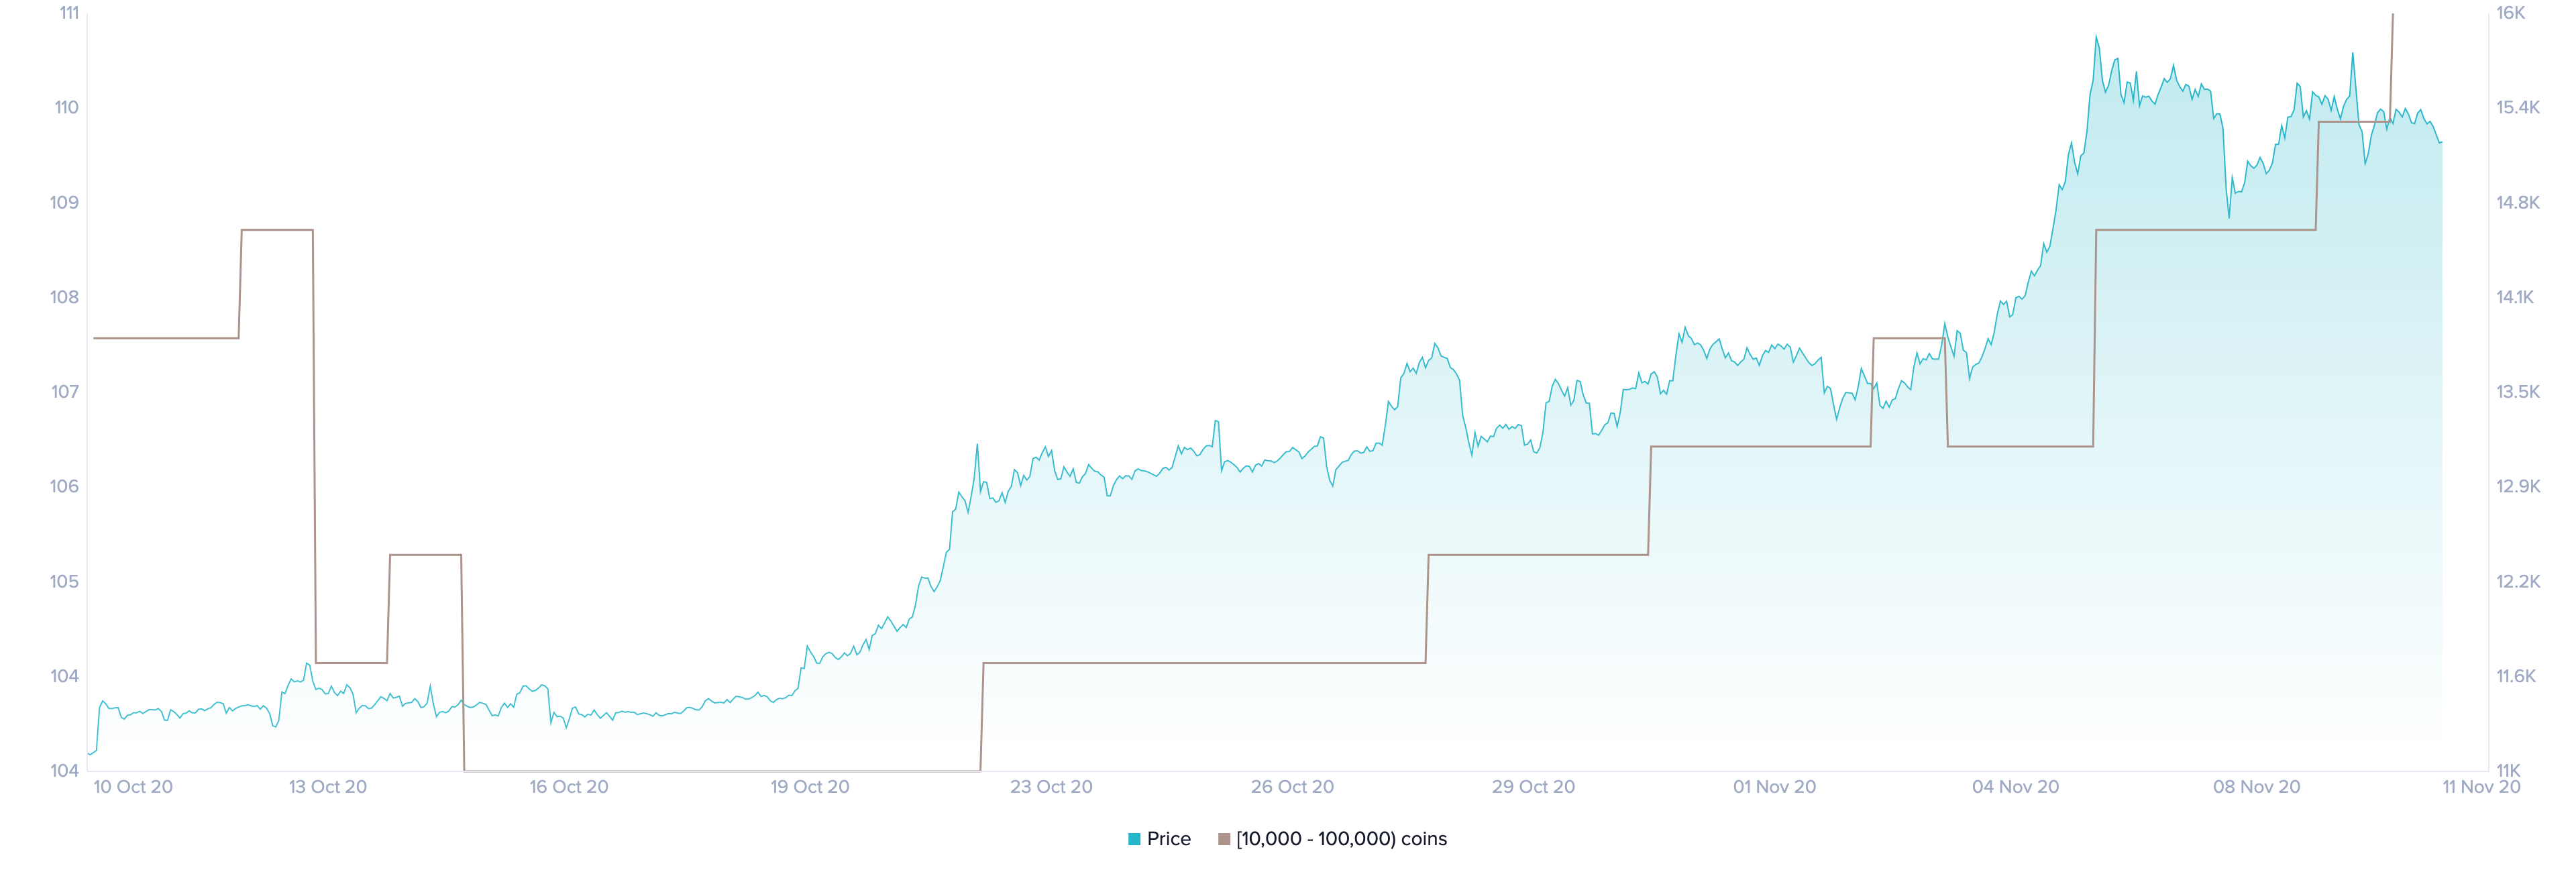
Despite the ambiguity that Bitcoin presents, data from the behavior analytics platform, Santiment reveals that whales are going into a buying frenzy. The number of addresses with 10,000 to 100,000 BTC surged nearly 7% in the last few weeks.
Approximately seven new whales have joined the network in such a short period.
The continuous increase in the number of big players behind Bitcoin may seem insignificant at first glance. Still, when considering they hold between $150 million to $1.5 billion in BTC, the spike in buying pressure can translate into billions of dollars.
If buy orders continue to pile up, Bitcoin may have the strength to move past the overhead resistance at $15,760. Turning this critical price hurdle into support could see the pioneer cryptocurrency rise towards the next supply wall at $17,250.
Regardless, the bearish outlook cannot be disregarded because of the high levels of greed among market participants. A sudden spike in downward pressure that sends Bitcoin below the $14,850 support may lead to a 10% correction towards $13,300.
Ethereum Breaks Out as Bulls Target $500
Ethereum appears to be breaking out of a symmetrical triangle formed over the past week, while prices remained stagnant. By measuring the distance between the initial high and low of the pattern and adding it to the breakout point, this technical formation forecasts a 10% target.
A further increase in the buying pressure behind the smart contracts giant could take it to trade at around $500.
IntoTheBlock’s “In/Out of the Money Around Price” (IOMAP) model adds credence to the bullish outlook. This on-chain metric reveals no significant supply barriers ahead of Ethereum, preventing it from achieving its upside potential.
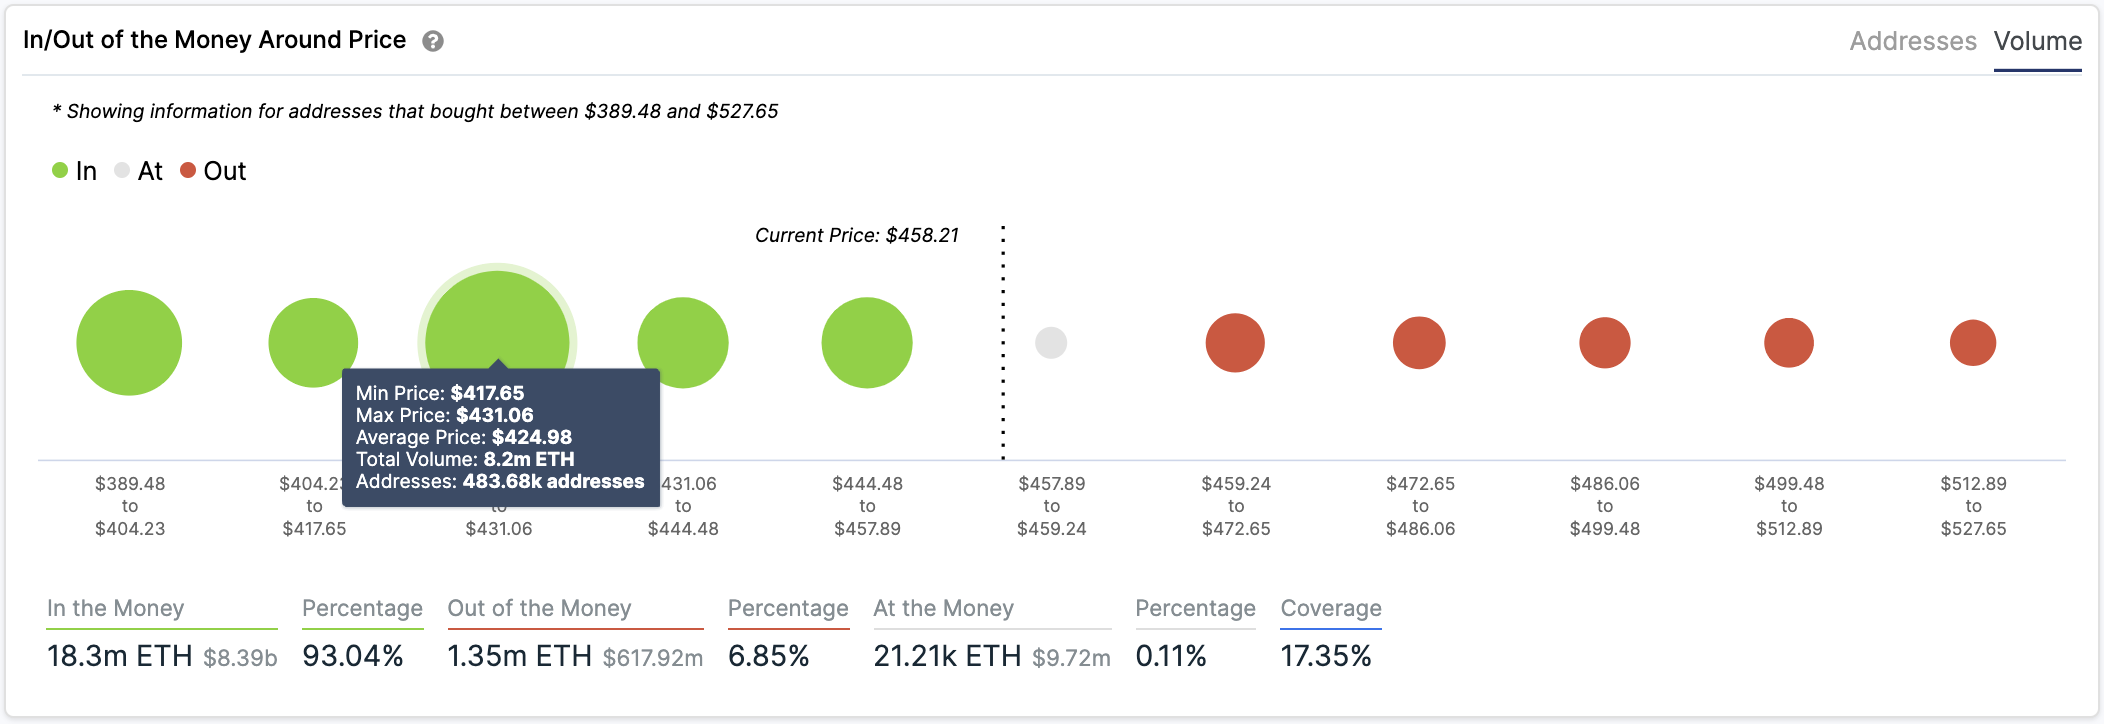
On the flip side, the IOMAP cohorts show that this cryptocurrency is trading on top of stable support. Nearly 500,000 addresses had previously purchased 8.2 million Ether between $417 and $431.
This massive demand zone may have the ability to absorb some of the selling pressure in the event of a correction.
XRP Holds Underneath Crucial Resistance
XRP has been contained between its 100-, 50-, and 200-day moving averages over the past month. These trend following indicators have reduced the price action into a tight trading range that is getting narrower over time.
While the rest of the market has made clear signals where it is headed next, the cross-border remittances token has failed to do so. A daily candlestick close above the 100-day moving average or below the 200-day moving average will determine the trend’s direction.
If demand rises around the current levels, XRP may have the strength to slice through the overhead resistance. Turning the 100-day moving average into support could see prices rise towards the next important area of interest, around $0.3.
Nonetheless, XRP’s price must continue to hold above the 200-day moving average for the optimistic scenario to prevail.
Breaking through this support level would be catastrophic for the altcoin as it might ignite panic selling among investors. Under such circumstances, the odds will drastically increase for a downswing to $0.21.
The Crypto Market Moves Forward
Ethereum appears to be leading today’s run-up in the cryptocurrency market. The bullish impulse behind it seems to be correlated with mounting speculation around ETH 2.0.
Data from Dune Analytics reveals that nearly 53,000 ether have been sent to the Ethereum 2.0 deposit contract over the past few days, showing the community’s interest in this crucial upgrade.
As the largest altcoin by market cap takes the spotlight, it looks like Bitcoin and XRP have fallen behind.
Though the high levels of correlation in the market suggest that these cryptocurrencies may soon catch up with Ethereum, only a break of their respective resistance barriers will confirm the optimistic outlook.