
EOS Prepares for Bullish Price Action Despite Stagnating User Growth
EOS failed to spark interest among traders because of stagnation of the blockchain's growth metrics. That may soon change.
Even though EOS has been relatively dormant, one technical index estimates prices may soon face extreme volatility.
EOS Prepares for High Volatility
The past few months have been quite dramatic for EOS holders. While most cryptocurrencies in the industry have been able to reach new yearly highs, this smart contract token continues to get held below the $3 resistance barrier. The altcoin recently rose to a high of $3.5, but as the crypto market crashed on Aug. 2, EOS went down with it.
The so-called “Ethereum killer” took a 28% nosedive within 30 minutes, dropping to a low of $2.5. Following the downswing, prices were able to recover partially and stabilize around the $3 mark.
Now, it seems that EOS entered a consolidation period as the Bollinger bands were forced to squeeze on its 4-hour chart. Squeezes are indicative of low volatility periods and are usually succeeded by significant price movements. The longer the squeeze, the higher the probability of a strong breakout.
This technical index does not provide a clear path about the direction of EOS’ trend. As a result, the area between the lower and upper band is a reasonable no-trade zone. Only a candlestick close above or below these crucial hurdles will determine where this altcoin is headed next.
Breaking above the overhead resistance could see a spike in buy orders behind this cryptocurrency. If this were to happen, the Fibonacci retracement indicator (measured from mid-February’s high of $5.5 to mid-March’s low of $1.4) suggests that EOS could retest the recent high of $3.5. Breaking through this crucial barrier will increase the odds for a further advance towards $4.
On the flip side, moving below the lower Bollinger band at $2.9 may result in more losses for the smart contracts token. The Fibonacci retracement index estimates that the next significant level of support sits around $2.3.
Odds Favor the Bulls
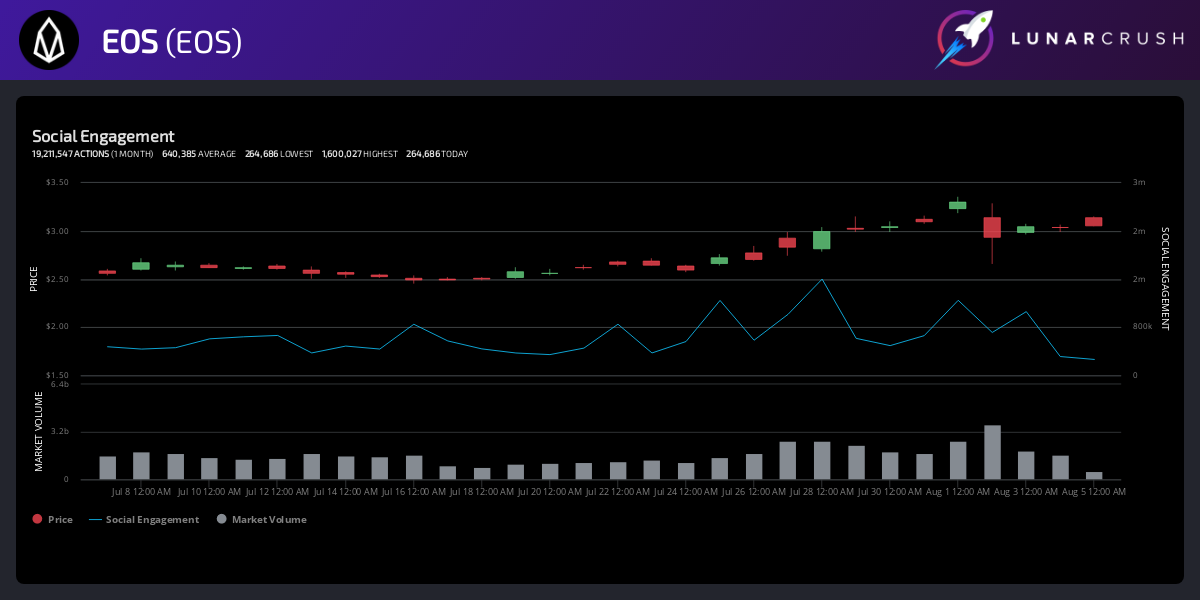
While EOS remains flat trading between $3.1 and $2.9, market participants seem to have forgotten about this cryptocurrency. Data from LunarCRUSH reveals that the number of EOS-related mentions across different social media networks has dropped significantly over the past few months.
EOS’s social engagement activity hit its lowest it has ever been since early May. This negative social sentiment is a direct result of the lackluster price and stagnating user adoption. But poor social perception could provide a good opportunity for traders to place a value-bet on EOS.
Regardless, traders must be patient to avoid getting caught on the wrong side of the trend. Waiting for a prime opportunity to enter is especially important now that the market seems to have entered a new bullish cycle.