 Earn with Nexo

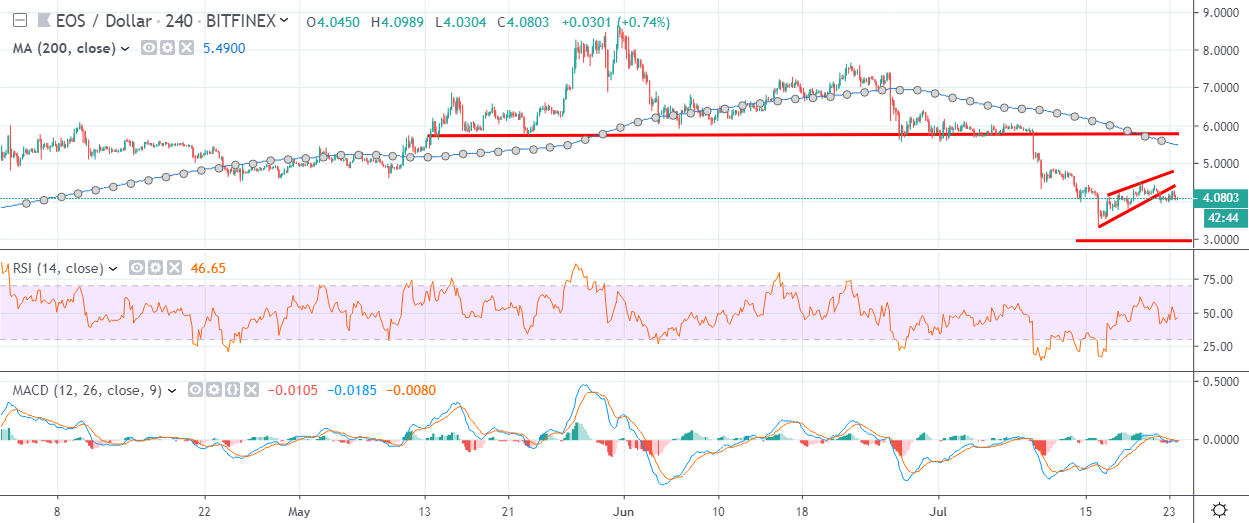
EOS Price Analysis EOS / USD: Gasping For Air
EOS is struggling to get back above its moving average.
- EOS has a bearish short-term outlook, with the cryptocurrency back under technical selling pressure
- The four-hour time frame is showing that a downside breakout from a falling wedge pattern is currently underway
- The daily time frame shows that the EOS / USD pair has turned technically bearish
EOS / USD Short-term price analysis
EOS has a bearish short-term trading outlook, with the cryptocurrency once again under heavy technical selling pressure.
The four-hour time frame shows that a head and shoulders pattern continues to play out to the downside, with the bearish pattern yet to reach its full downside objective.
Technical indicators on the four-hour time frame have once again turned bearish and continue to generate sell signals.
Pattern Watch
Traders should note that a bearish breakout from a small falling wedge pattern is also underway on the four-hour time frame.
Relative Strength Index
The RSI indicator is bearish on the four-hour time frame is starting to issue a sell signal.
MACD Indicator
The MACD indicator on the four-hour time frame has turned bearish and is starting to generate a strong sell signal.
EOS / USD Medium-term price analysis
EOS now has a bearish medium-term bias, with the cryptocurrency continuing to trade below its trend defining 200-day moving average.
The daily time frame is showing that bulls are still unable to move the EOS / USD pair above critical technical resistance. The 3.000 support level may start to come into focus if the currently monthly trading low is breached.
Technical indicators are bearish on the daily time frame and continue to issue sell signals.

Pattern Watch
Traders should note that a bullish pattern is still present on the daily time frame that has yet to be technically invalidated.
Relative Strength Index
The Relative Strength Index remains bearish on the daily time frame and continues to turn lower.
MACD Indicator
The MACD indicator on the daily time frame is bearish, although it is starting to appear overstretched to the downside.
Conclusion
EOS is back under heavy downside pressure, with the cryptocurrency repeatedly struggling to move back above its key 200-day moving average.
Both time frames suggest that the 3.000 support level may start to come into focus if the current monthly trading low is broken over the coming trading sessions.
For a quick check up of the basics of EOS, we published a coin guide.