
EOS Price Analysis EOS / USD: Glimmer Of Hope
Despite continuing technical weakness, not all is lost for EOS.
- EOS remains technically bearish across the short and medium-term, as the cryptocurrency looks set for its fifth straight week of trading losses
- A bearish head and shoulders pattern suggests that a drop towards the $3.00 level is coming.
EOS is back under downside pressure on Thursday after the early week rally towards the $3.80 resistance level faded out, leaving the cryptocurrency on course for its fifth consecutive week of trading losses. At current levels, the EOS / USD pair has lost close to seventeen percent in value since the start of August.
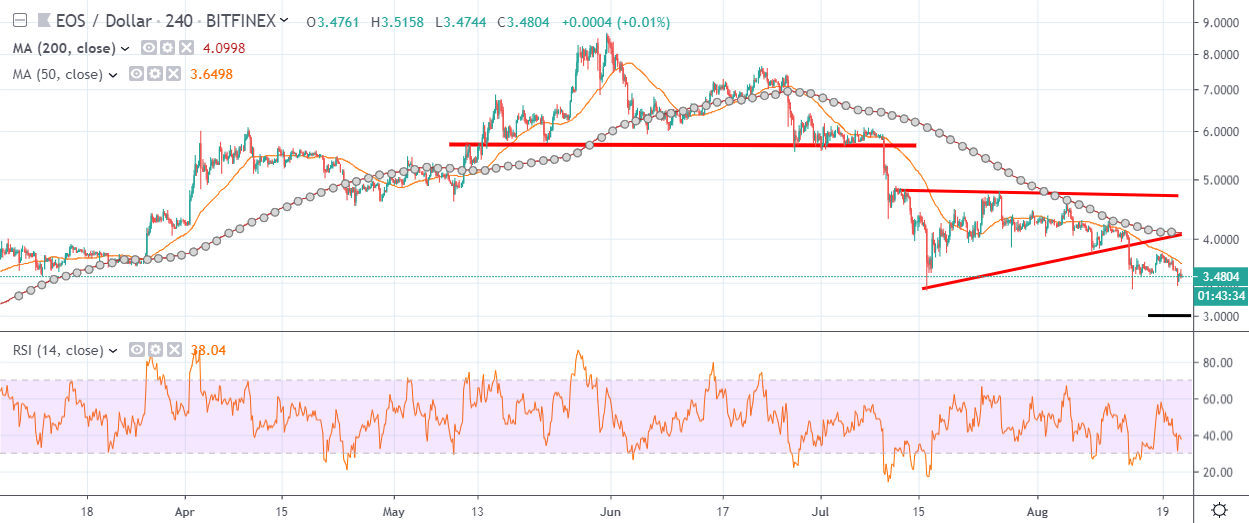
Going forward, the technicals for EOS are growing increasingly bearish, with the four-hour time frame projecting that the cryptocurrency could decline towards the $3.00 level. The $3.00 level is the overall target of a bearish head and shoulders pattern on the mentioned time frame, that was triggered when sellers broke through the $5.66 level on July 10th. The cryptocurrency has been on a downward spiral ever since.
The four-hour time frame also shows that a bearish ascending triangle breakout is in progress, which also has the $3.00 level as the overall downside target.
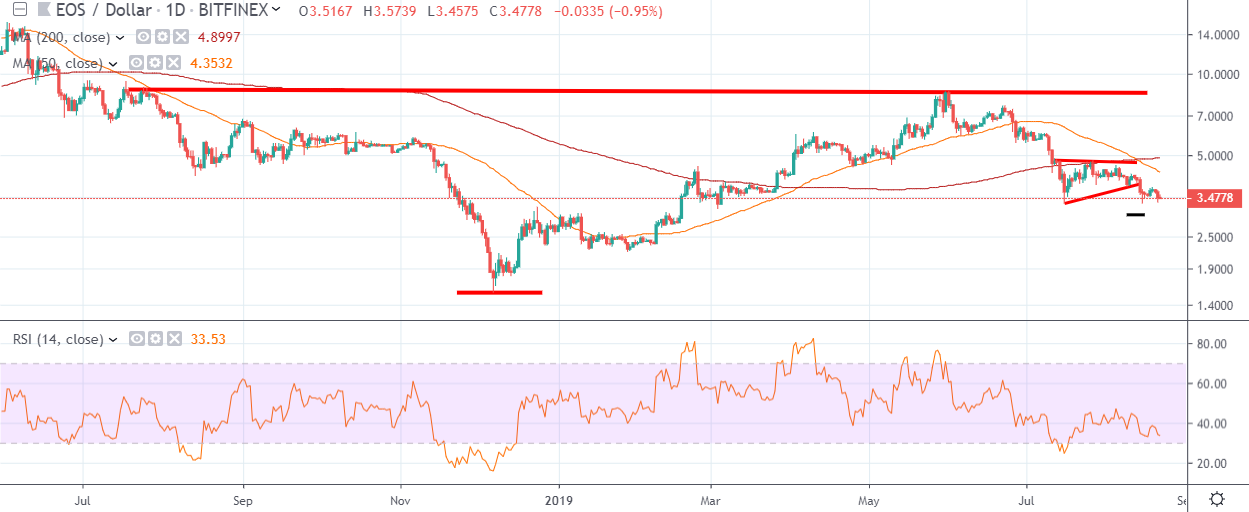
Despite the bearish technical outlook, all may not be lost for the EOS / USD pair, as the daily time frame continues to show a huge bullish pattern, that remains valid if buyers maintain price above the $1.80 support level.
Going forward, a break below the $3.32 level should be the bearish trigger for a further decline towards the $3.00 level. Equally, continued weakness across the broader cryptocurrency market could provide the momentum needed to reach the $3.00 level.
According to the latest sentiment data from TheTIE.io, the short-term sentiment towards EOS is currently bearish, at 42.98 %, while the overall long-term sentiment towards the cryptocurrency is overwhelmingly positive, at 69.33%.
Upside Potential
The four-hour time frame is showing that bulls need to hold price above the EOS / USD pair’s 50-period moving average, at $3.64, to stabilize the cryptocurrency. Above the $3.64 level the currently weekly trading high, at $3.80, offers strong resistance prior to the rising trendline resistance from the previously mentioned descending triangle pattern, at $.4.08.
The daily time frame highlights that the 50-day moving average has crossed over the 200-day moving average, which is extremely bearish. Buyers need to move price above the $4.34 level to negate the bearish moving average crossover.
Downside Potential
The downside potential for the EOS / USD pair is unlikely to extend too far beyond the $3.00 level if we do see the monthly trading low, at $3.32, broken. However, the February 10th swing-low, at $2.70, offers the strongest form of support below the $3.00 level if we do see a deeper decline.
The Relative Strength Index across both the four-hour and daily time frame is bearish and shows that despite the recent double-digit decline, the EOS / USD pair has yet to reach oversold conditions.
Summary
EOS is extremely weak from a technical perspective, with bearish patterns on the four-hour time frame pointing to an upcoming drop towards the $3.00 level.
However, the daily time frame shows that a huge bullish pattern is still in play, which remains valid while bulls keep the price above the $1.80 support level.
For a quick check up of the basics of EOS, we published a coin guide.