 Earn with Nexo

EOS Price Analysis EOS / USD: Filling In The Pattern
EOS is going down, but it's just a correction on the daily time frame.
- EOS has a bearish short-term outlook, with the cryptocurrency trading well below key technical support
- The EOS / USD pair has triggered a bearish head and shoulders pattern on the four-hour time frame
- The daily time frame continues to show the existence of a valid inverted head and shoulders pattern
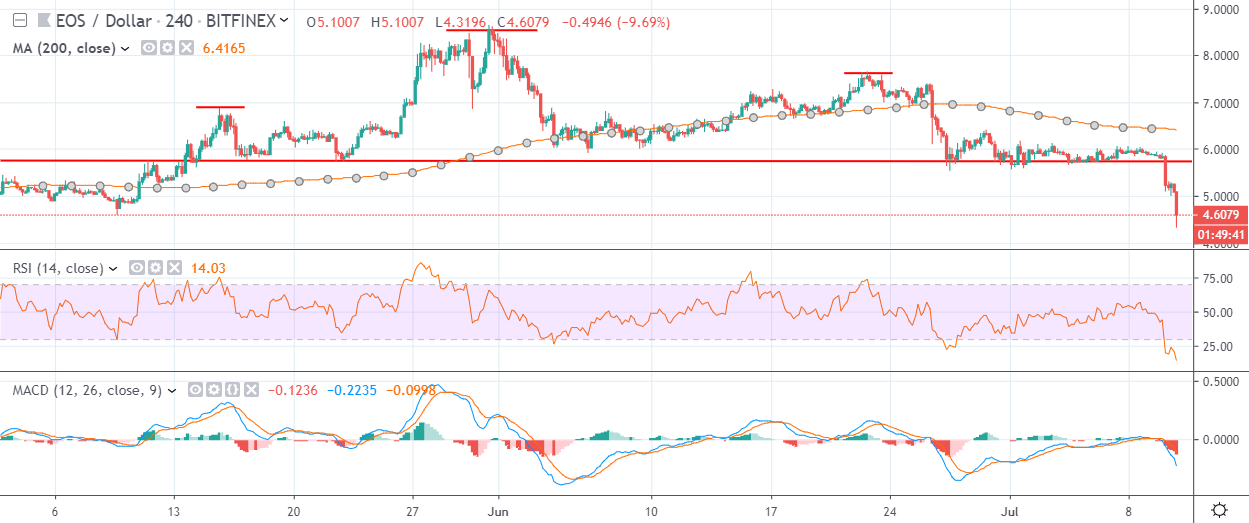
EOS / USD Short-term price analysis
EOS has a bearish short-term trading outlook, with the cryptocurrency tumbling well below key technical on the four-hour time frame.
The four-hour time frame shows that a head and shoulders pattern has been triggered into action, with the EOS / USD pair still in bearish correction mode.
Technical indicators on the four-hour time frame have turned heavily bearish and are starting to generate a strong sell signal.
Pattern Watch
Traders should note that the downside target of the head and shoulders pattern on the four-hour time frame would take the EOS / USD pair back towards the 3.000 level.
Relative Strength Index
The RSI indicator is bearish on the four-hour time frame and has already moved into oversold territory.
MACD Indicator
The MACD indicator on the four-hour time frame has turned bearish and is starting to generate a strong sell signal.
EOS / USD Medium-term price analysis
EOS now has a neutral medium-term outlook, with the cryptocurrency now testing its trend defining 200-day moving average.
The daily time frame is showing that a strong downward correction is currently underway, after price fell below the neckline of large inverted head and shoulders pattern.
Technical indicators are bearish on the daily time frame and continue to issue a sell signal.

Pattern Watch
Traders should note that the recent bearish move may be helping to form a right-hand shoulder, to complete the large inverted head and shoulders pattern.
Relative Strength Index
The Relative Strength Indicator is bearish on the daily time and still shows scope for further downside.
MACD Indicator
The MACD indicator on the daily time frame is bearish and continues to generate a strong sell signal.
Conclusion
EOS is under heavy downside pressure in the short-term, with the bearish pattern on the four-hour time frame indicating that the worst may not yet be over for the EOS / USD pair.
The daily time frame still suggests that the latest down move is likely corrective in nature and may be helping to complete the structure of the large bullish pattern.
For a quick check up of the basics of EOS, we published a coin guide.