EOS / USD Price Analysis: Pressured
The pair is under pressure in the short term, but its technicals remain bullish.

Share this article
- EOS is bullish in the short-term, with the cryptocurrency still holding price above major technical support
- The EOS / USD pair continues to trade above its 200-day moving average
- The daily time shows that a bullish inverted head and shoulders pattern has formed
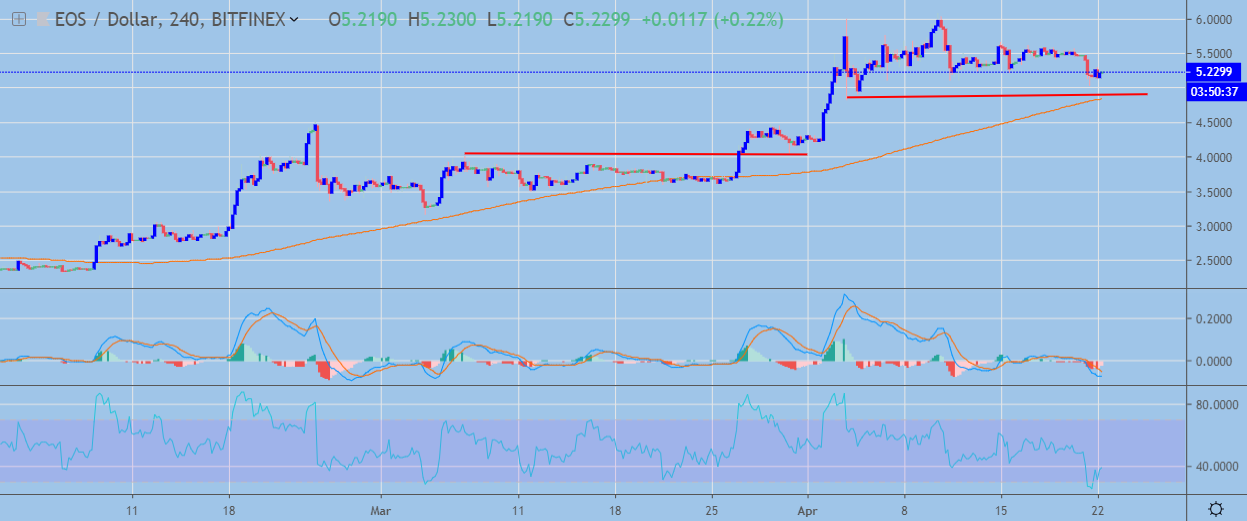
EOS / USD Short-term price analysis
EOS has a bullish short-term trading outlook, with the cryptocurrency still holding price above major technical support on the four-hour time frame.
The four-hour time frame is showing a head and shoulders pattern, with the neckline of the bearish pattern converging with the EOS / USD pair’s 200-period moving average.
The right-hand shoulder of the invalidated head and shoulders pattern on the four-hour time frame is now its key support below the 200-period moving average.
 EOS / USD H4 Chart by TradingView
Pattern Watch
Traders should note that caution is advised when trading a bearish breakout as the overall short-term and medium-term trend still remains bullish.
Relative Strength Index
The RSI indicator is also bearish on the four-hour time frame, although it is attempting to correct from oversold conditions.
MACD
The MACD indicator on the four-hour time frame is bearish, with the MACD signal line issuing a strong sell signal.
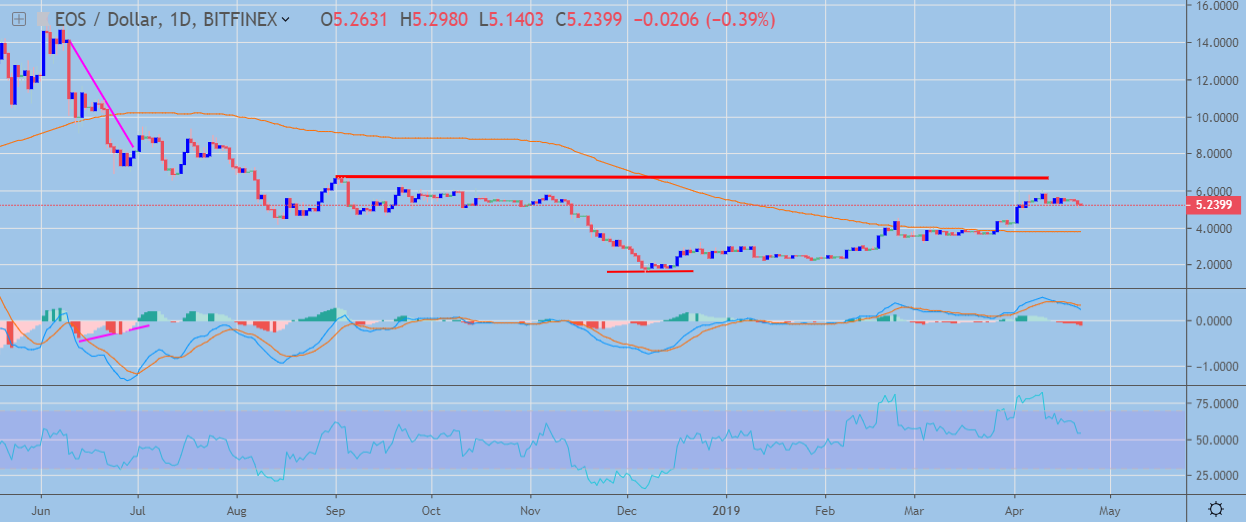
EOS / USD Medium-term price analysis
EOS has a bullish medium-term outlook, with the cryptocurrency still holding price above its key 200-day moving average.
The daily time frame is showing that a large inverted head and shoulders pattern has formed, with buyers so far unable to move price above neckline resistance.
The daily time frame continues to show bullish MACD price divergence, which extends towards the June 2018 swing-high.
 EOS / USD Daily Chart by TradingView
Pattern Watch
Traders should note that the bullish projection of the inverted head and shoulders pattern would take the EOS / USD pair towards the June 9th swing-high from last year.
Relative Strength Index
The Relative Strength Index is moving lower as downside selling pressures build across the daily time frame.
MACD
The MACD indicator on the daily time frame has turned bearish, although bullish MACD price divergence is still present from last year.
Conclusion
EOS / USD is coming under pressure in the short-term, with technical indicators across both time frames highlighting that a deeper technical correction may occur.
The large inverted head and shoulders pattern on the daily time frame and the bullish MACD price divergence suggest that the EOS / USD pair can still trade much higher over the medium-term.
For a quick intro into EOS, check out our coin guide.
Share this article
