
EOS Price Analysis EOS / USD: Unstoppable Momentum
The pair performed a powerful bullish breakout and is set for further gains.
- EOS has a bullish short-term outlook, with the cryptocurrency advancing to its highest trading level since July 2018
- The four-hour time frame shows that the bullish inverted head and shoulders pattern has now reached its upside target
- The daily time frame shows that a major technical breakout is still underway
EOS / USD Short-term price analysis
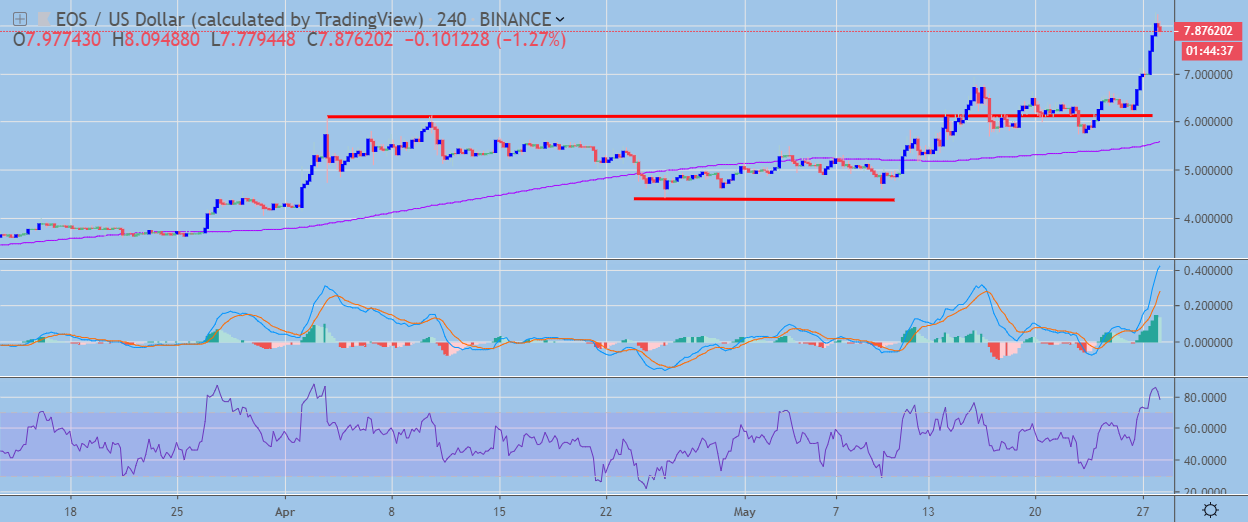
EOS has a bullish short-term bias, with the cryptocurrency advancing to its highest trading level since July 2018.
The four-hour time frame shows that buyers have triggered an inverted head and shoulders pattern, with the bullish pattern already reaching its upside projection.
Technical indicators on the four-hour time frame have turned bullish and continue to generate buy signals.
 EOS / USD H4 Chart by TradingView
Pattern Watch
Traders should note that a small head and shoulders pattern has also been invalidated on the four-hour time frame.
Relative Strength Index
The RSI indicator is bullish on the four-hour time frame, although it is now trading in overbought territory.
MACD Indicator
The MACD indicator on the four-hour time frame has turned bullish and continues to generate a buy signal.
Fundamental Analysis
EOS has surged after the release of CCID’s latest crypto rankings, where it retained its top spot. CCID is a government-sponsored index which ranks blockchains on three criteria: technology, application and innovation.
EOS / USD Medium-term price analysis
EOS has a bullish medium-term outlook, with the cryptocurrency performing a major technical breakout on the daily time frame.
The daily time frame is showing that EOS / USD buyers have finally triggered a large inverted head and shoulders pattern with substantial upside potential.
Technical indicators are bullish on the daily time frame and continue to issue a buy signal.
 EOS / USD Daily Chart by TradingView
Pattern Watch
Traders should note that the July 15th swing high is the initial target of the bullish inverted head and shoulders pattern on the daily time frame.
Relative Strength Index
The Relative Strength Indicator is bullish on the daily time frame and continues to highlight the growing buying interest over the medium-term.
MACD Indicator
The MACD indicator on the daily time frame is bullish and is still generating a strong buy signal.
Fundamental Analysis
In the medium term, EOS looks interesting. There will be several important events and announcements in June that could potentially drive its momentum.
Conclusion
EOS has performed a major bullish breakout on the daily time frame, which could lead to it trading significantly higher over the medium-term.
Any near-term pullbacks are likely to meet strong dip-buying demand from neckline support on both the four-hour and daily time frames.
For a quick check up of the basics of EOS, we published a coin guide.