Getting Past $10,000 May Ignite a New Bitcoin Bull Run
Bitcoin surged by more than 9% over the weekend to retest the $10,000 resistace level, but this hurdle continues to hold.
Bitcoin looks ready to enter a new bullish cycle, but getting past the $10,000 resistance level is proving to be a significant barrier.
A Major Resistance Wall Ahead of Bitcoin
Bitcoin had quite an impressive weekend despite threats of a steep correction down to $6,000
Even with all the fear, uncertainty, and doubt, the flagship cryptocurrency was able to surge more than 9%. It went from trading at a low of $9,100 on Friday to recently hit a high of $9,960.
This marks the second weekend that high levels of volatility have struck Bitcoin.
While the weekend of May 9 can be considered bearish as BTC took a 20% nosedive, the last few days have since been bullish. But, the bellwether cryptocurrency has yet to break above the infamous $10,000 resistance level.
Some of the most prominent analysts in the industry have identified this level as the catalyst that ignites a new bull market.
Derivative trader Tyler Coates, for instance, argues that the pioneer cryptocurrency may be developing a cup and handle pattern in its 4-hour chart. If validated, the bullish formation projects a 20% target to the upside that can send Bitcoin towards $11,000 or $12,000 upon the breakout point.
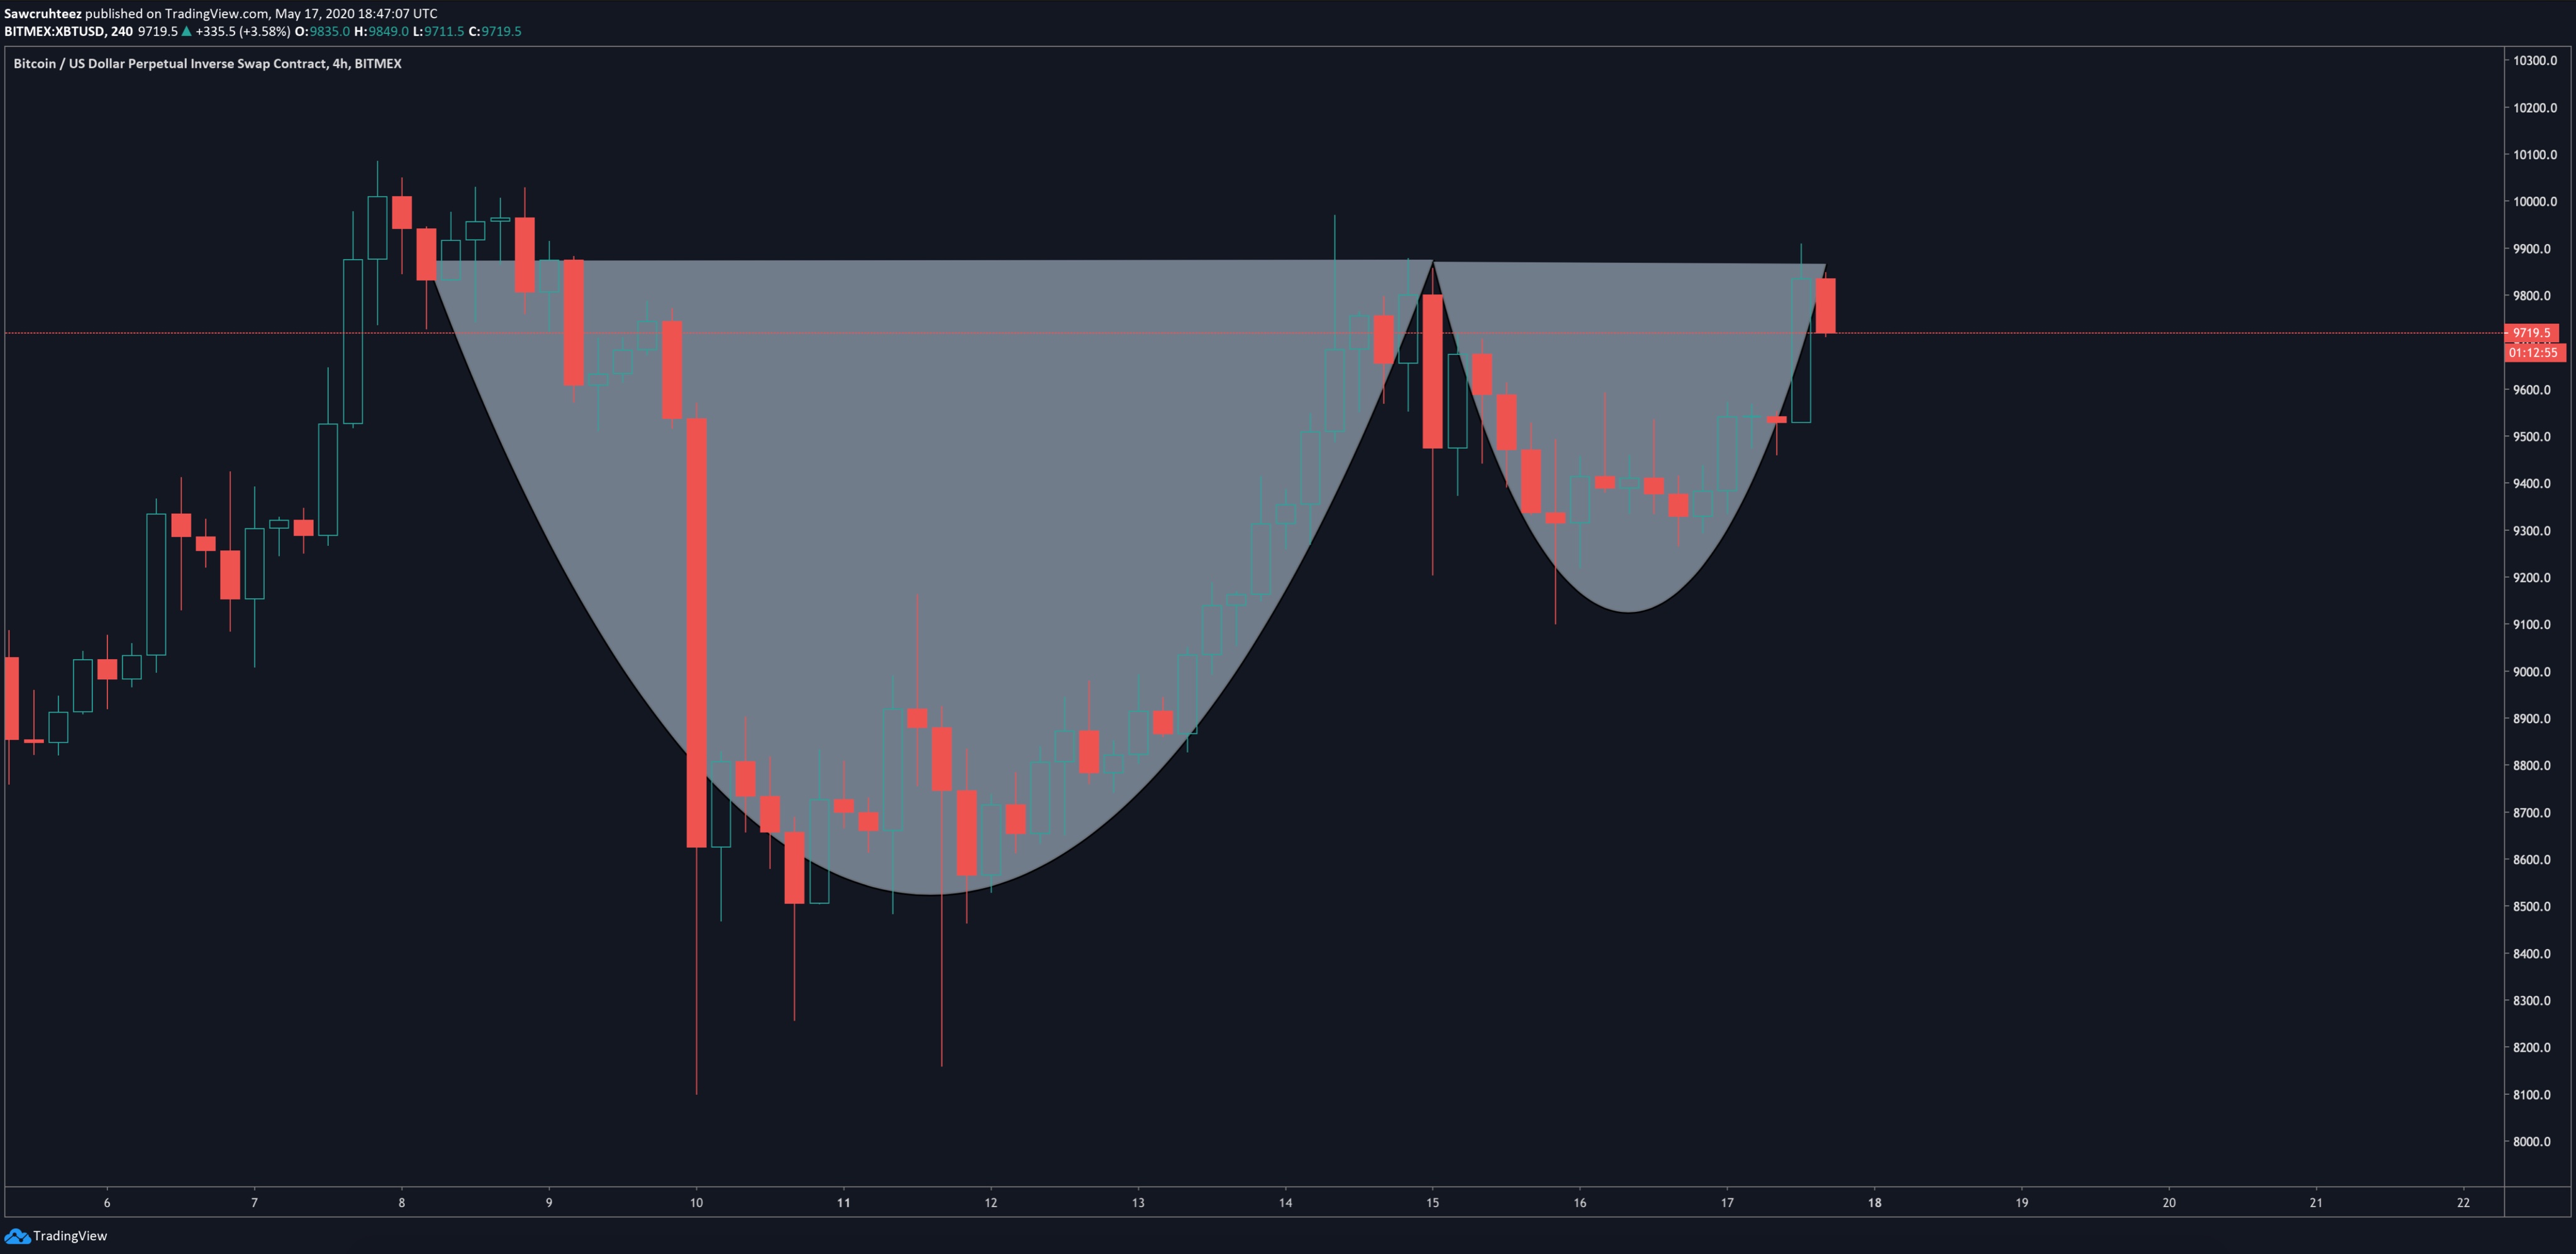
Coates pointed out that even though the cup and handle is “likely” to be confirmed, the order book suggests “it is still too soon.” The analysts made this claim after noticing a massive sell wall sitting around $10,000.
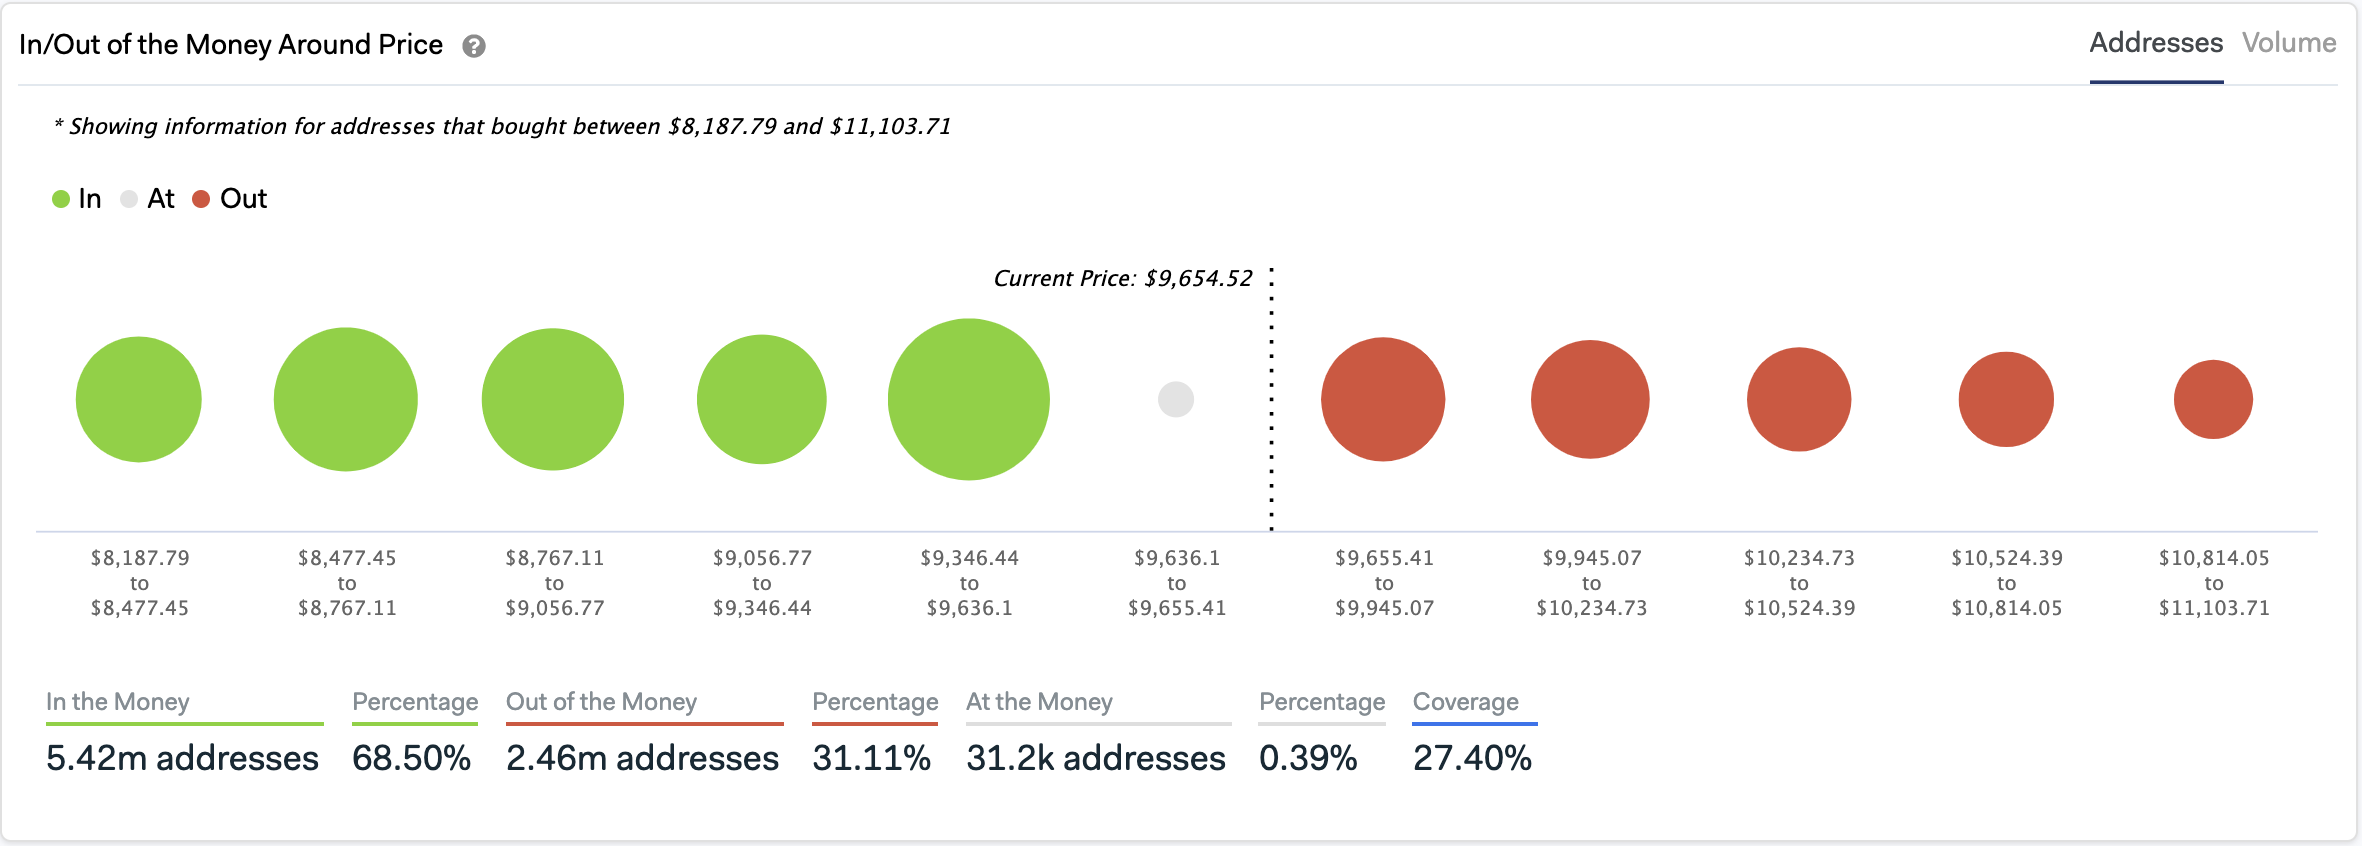
IntoTheBlock’s “In/Out of the Money Around Price” (IOMAP) model adds credence to the strength of this resistance level.
This on-chain metric indicates that 1.2 million addresses bought more than 530,000 BTC between $9,900 and $10,500.
An Ambiguous Outlook
The aforementioned supply wall appears to have rejected the price of Bitcoin over the past few hours.
Subsequently, the flagship cryptocurrency lost 5% of its weekend gains and is now trading around $9,600.
Due to the drastic ambiguity that BTC presents, it is reasonable to consider from a long-term perspective the area between $10,000 and $9,000 a no-trade zone.
Breaking above the resistance could be followed by a move towards mid-February’s swing high of $10,500. A rise in the buying pressure behind Bitcoin around this price level would increase the odds for an upswing towards $12,000 or higher.
A bearish impulse that pushes Bitcoin below support, however, can ignite a major sell-off.
The bearish momentum would likely be fueled by a massive number of liquidations from those who believed that the halving would inaugurate the next bull cycle.
On its way down, the bellwether cryptocurrency may find support around the 38.2% or 50% Fibonacci retracement level. These areas of support sit at $7,600 and $6,850, respectively.
Moving Forward
Bitcoin sits at a pivotal point in its trend. While multiple factors suggest that a correction is underway, different on-chain metrics highlight that BTC is poised for a full-blown bull run.
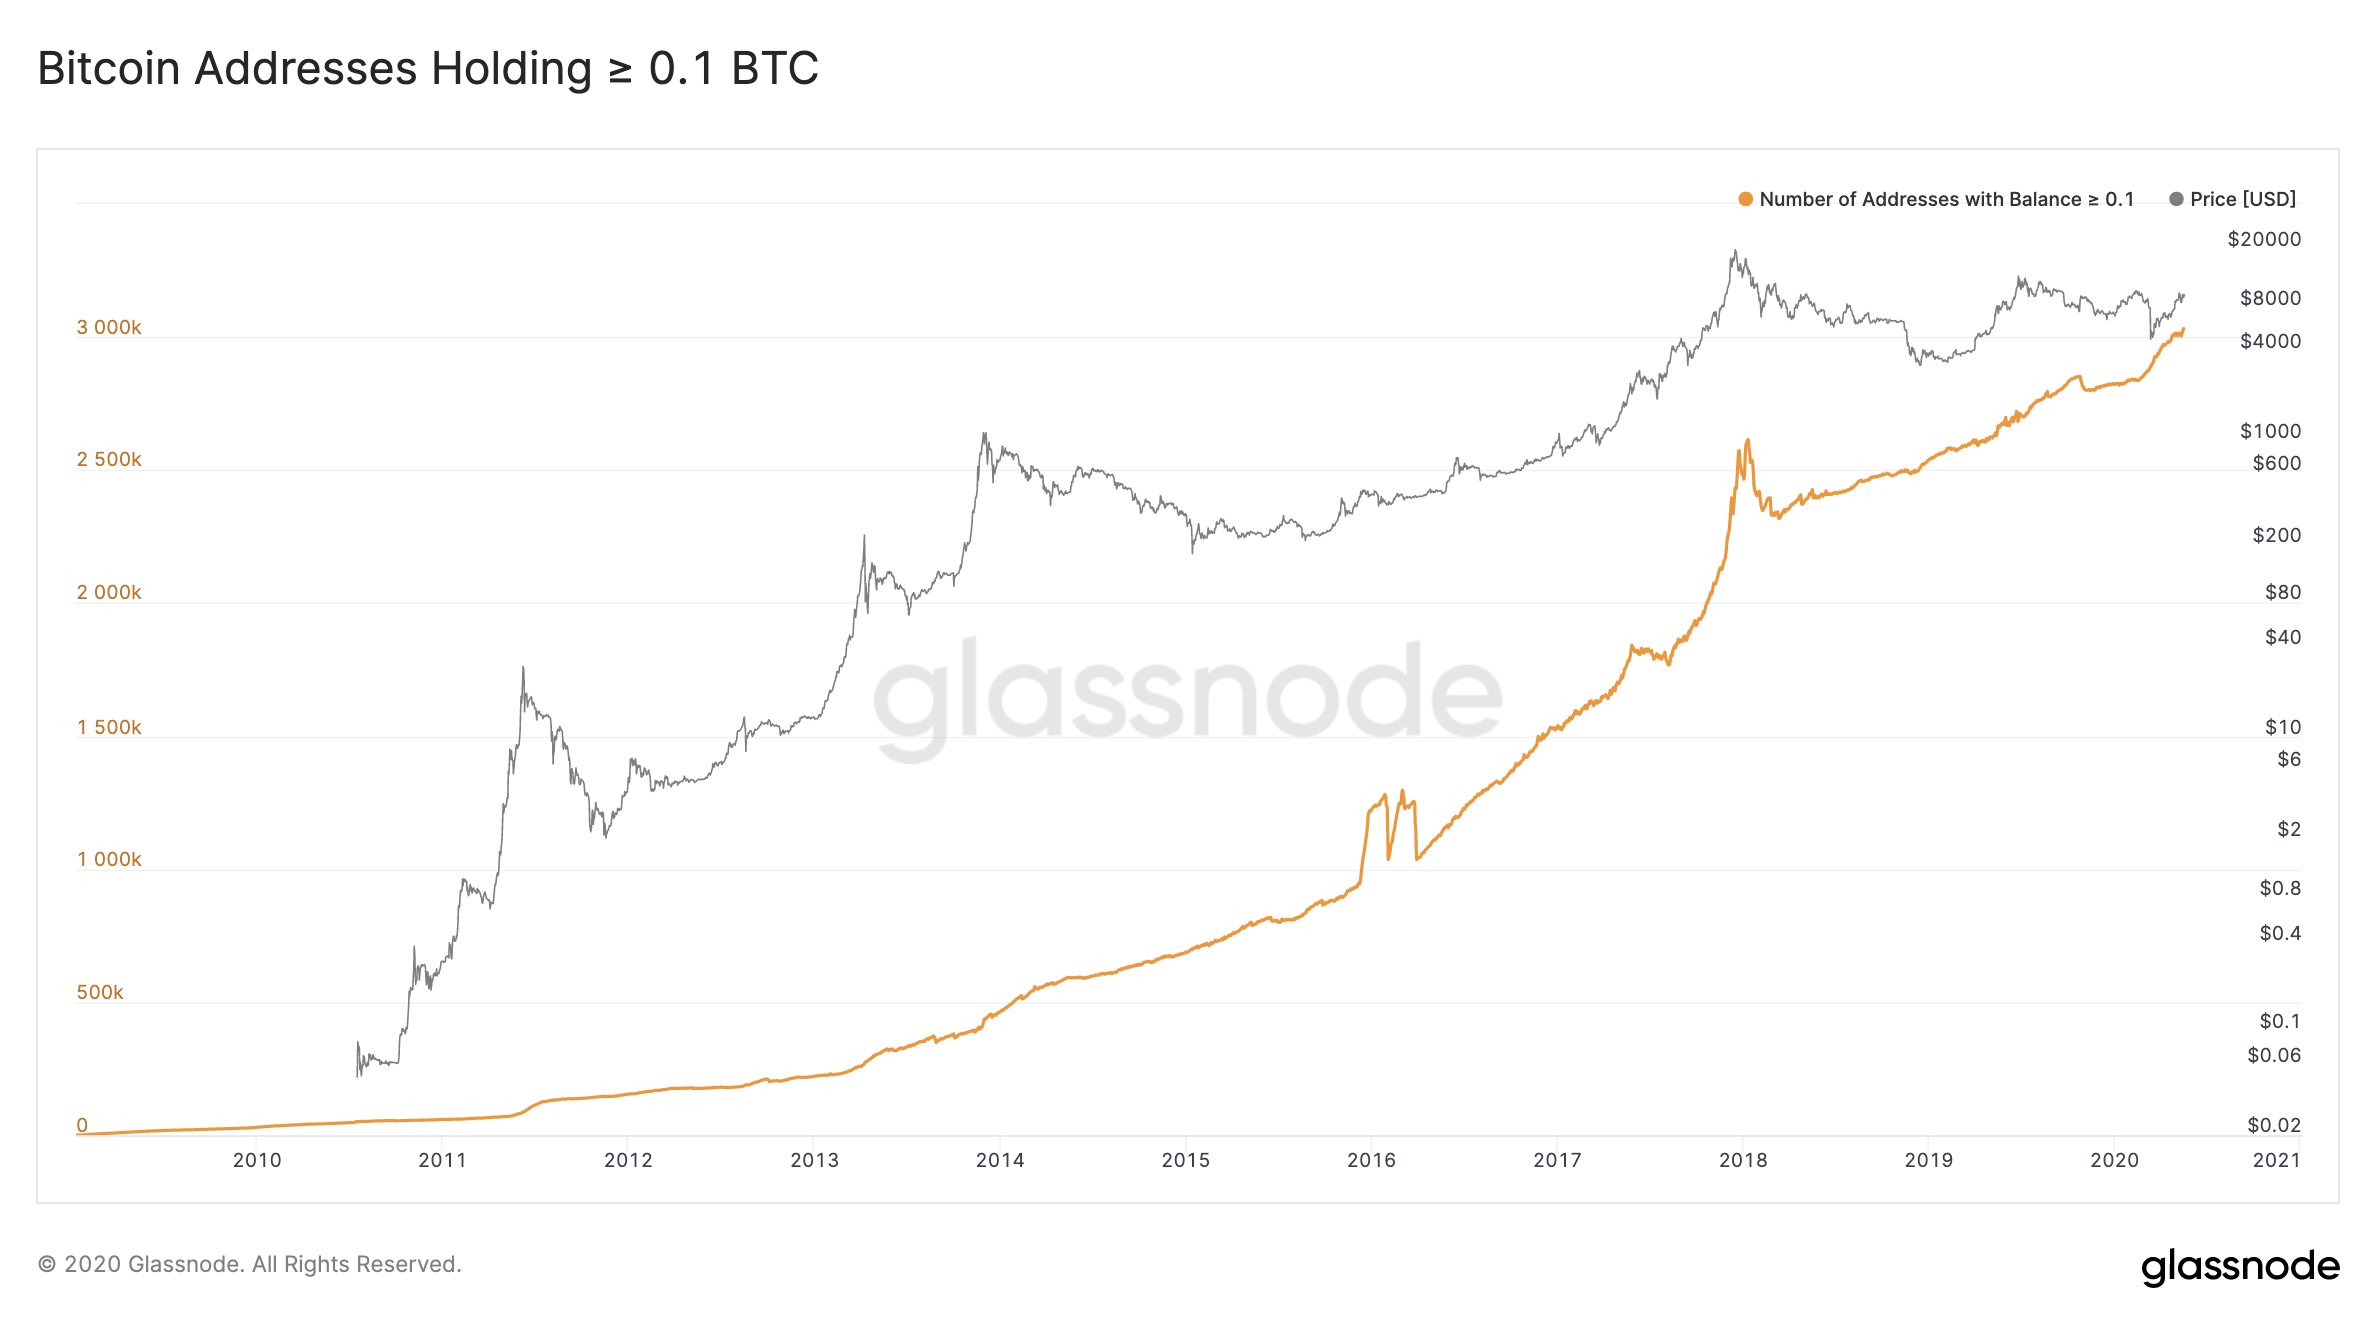
For the first time in its short history, there are now more than three million Bitcoin addresses holding at least 0.1 BTC. Data from Glassnode reveals that this represents a 14% increase over the past year.
And retail investors are not the only ones jumping on the Bitcoin bandwagon.
Hedge fund mogul Paul Tudor Jones made headlines after issuing a report where he outlined his interest in Bitcoin. Jones made a reasoned argument that Bitcoin is a hedge against inflation and growing uncertainty in the global economy.
“Bitcoin reminds me of gold when I first got in the business in 1976,” said Jones.
Meanwhile, the author of the “Rich Dad Poor Dad” finance book series, Robert Kiyosaki, believes that Bitcoin could surge to $75,000 within the next three years.
In a tweet that went viral, Kiyosaki says he is betting on Bitcoin and other precious metals due to the unprecedented money printing by central banks around the world.
“ECONOMY dying. FED incompetent. Next BAILOUT trillions in pensions. HOPE fading. Bought more gold silver Bitcoin. GOLD at $1700. Predict $3000 in 1 year. Silver at $17. Predict $40 in 5 years. Bitcoin at $9800. Predict $75000 in 3 years. PRAY for the BEST-PREPARE for the WORST.” affirmed Kiyosaki.
Even though it may take a while before Bitcoin surges to $75,000, a popular pricing model estimates that it is marching towards this level and even higher.
Plan B’s stock-to-flow (S2F) model has been incredibly accurate over the years at anticipating where BTC is headed next. Under the premise that Bitcoin’s scarcity is highly correlated with the value of the network, the recent halving could push Bitcoin’s market cap towards $5.5 trillion, according to the S2F.
This would translate into a $288,000 Bitcoin by 2022.
As investors and market participants alike grow overwhelmingly bullish about what the future holds, the latest downward impulse may be the last stop before Bitcoin’s next trip to the moon.