GXChain Price Analysis GXC / USD: Short-Lived Buyback Boom
GXChain is surging after a buyback announcement.

Share this article
- GXChain has a bullish short-term bias with the cryptocurrency advancing to a new all-time high
- The GXC / USD pair has performed a major bullish breakout on the daily time frame
- Technical indicators across both time frames are starting to appear overstretched
Fundamental Analysis
GXChain has surged after the project announced a second round of buy-backs for the amount of 500,000 USDT. The team’s reasoning behind the buy-backs is that the project “has been undervalued by the market”.
Although it is hard to predict the price movement after the end of the buy-back program, the GXChain has been ranked in the top-10 blockchain platforms according to CCID’s latest crypto rankings. CCID is a Chinese government-sponsored index which ranks blockchains on three criteria: technology, application and innovation.
GXChain / USD Short-term price analysis
GXChain has a bullish short-term outlook, with the cryptocurrency advancing to a new all-time trading high.
The four-hour time frame shows that the GXC / USD pair has been eroding the presence of any bearish patterns, with the recent advance now reaching its bullish objective.
Technical indicators on the four-hour are bullish, although they are starting to appear overstretched to the upside.
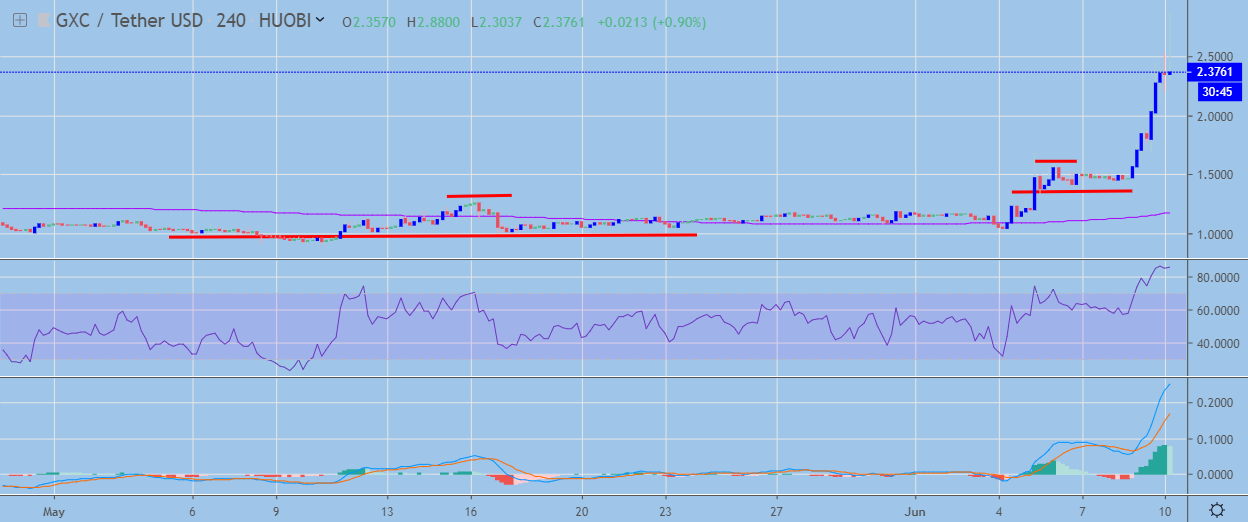 GXC / USD H4 Chart by TradingView
Pattern Watch
Traders should note that a strong technical correction may occur on the four-hour time frame now that GXC / USD pair has reached its bullish target.
Relative Strength Index
The RSI indicator is still bullish on the four-hour time frame, although it is starting to appear overstretched.
MACD Indicator
The MACD indicator is bullish on the four-hour time frame and continues to generate a buy signal.
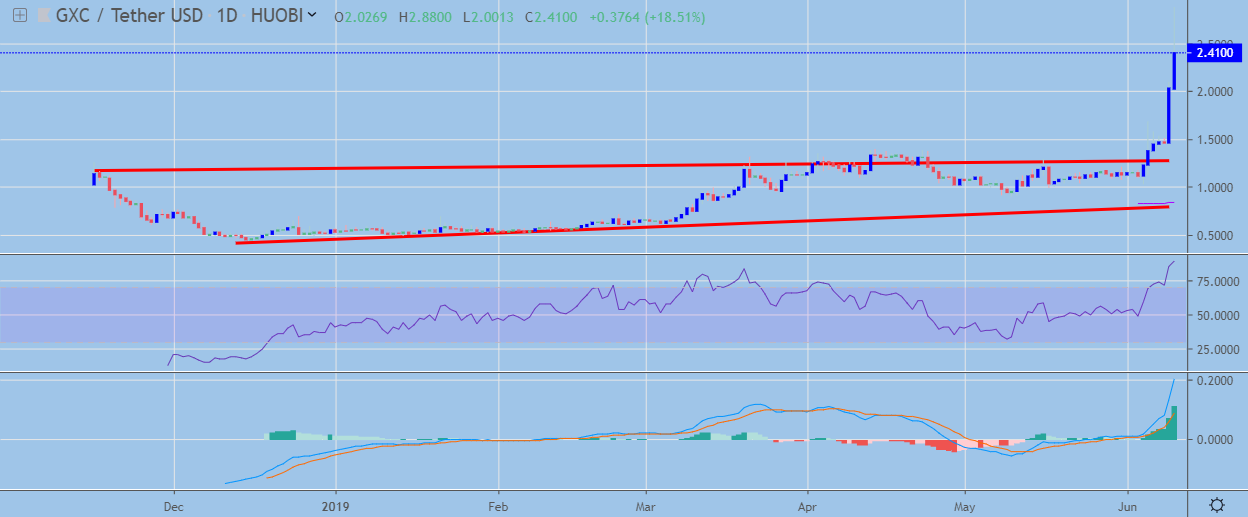
GXChain / USD Medium-term price analysis
GXChain has a bullish medium-term outlook, with the GXC / USD performing a major technical breakout on the daily time frame.
The daily time frame is showing that a confirmed bullish breakout has occurred from an ascending triangle pattern, with the GXC / USD pair already reaching its upside objective.
Technical indicators on the daily frame are bullish and are now trading in extremely overbought conditions.
 GXC / USD Daily Chart by TradingView
Pattern Watch
Traders should note that ascending triangle patterns are considered bullish and typically have a higher percentage of success during uptrends.
Relative Strength Index
The RSI indicator has turned bullish on the daily time frame and is also trading in extremely overbought territory.
MACD Indicator
The MACD indicator is bullish on the daily time frame and is currently trading in extreme overbought territory.
Conclusion
GXChain has performed a major bullish technical breakout on both time horizons, with GXC / USD bulls finally igniting the bullish pattern on the daily time frame.
Overbought technical readings are currently warning that the cryptocurrency could start to correct lower now that it has reached its bullish objective.
Check out our coin guide for a quick introduction to GXChain.
Share this article
