GXChain Price Analysis GXC / BTC: Baiting The Bulls
The project has several initiatives that contribute to a positive price trend.

Share this article
- GXChain has a bullish short-term bias against Bitcoin, with the GXC / BTC pair breaking above key resistance
- The four-hour time frame is showing that a bullish inverted head and shoulders pattern is forming
- A bearish head and shoulders pattern continues to take shape on the daily time frame
Fundamental Analysis
GXChain has gained bullish momentum after the company announced a 2 Million GXC Incentives for the Construction of the “Gravity Network” which should increase the adoption of the network and bring additional users to the ecosystem. The project also is currently conducting a buy-back program. While 40% of its buy-back fund has not been used yet, this may race additional interest to the project from the speculators.
GXChain / BTC Short-term price analysis
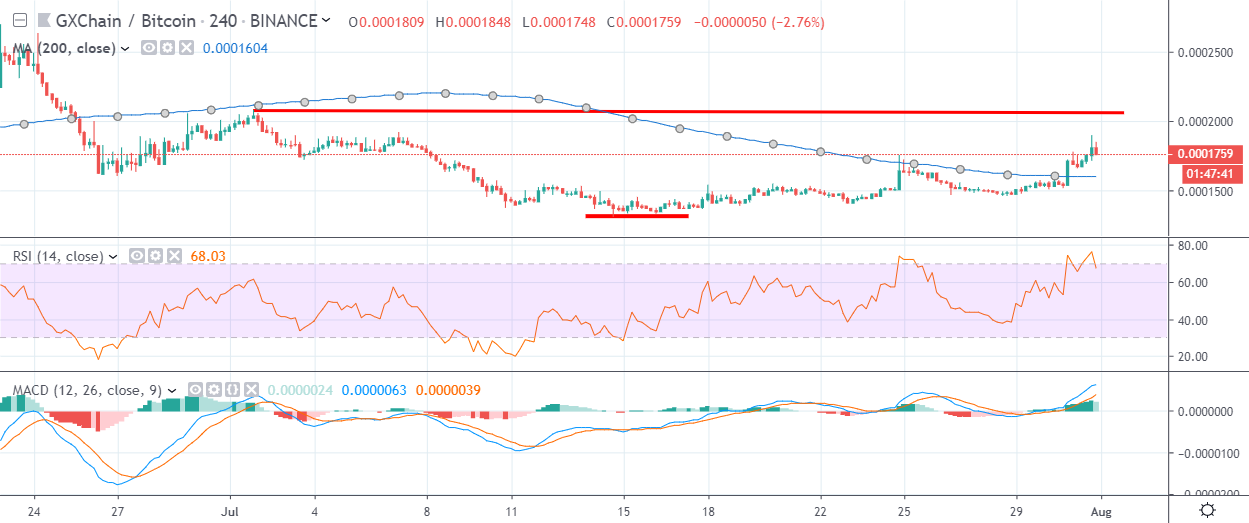
GXChain has a bullish short-term bias against Bitcoin, with the cryptocurrency recovering back above its 200-period moving average on the four-hour time frame.
The four-hour time frame shows that the GXC / BTC pair is forming a bullish inverted head and shoulders pattern, which could prompt a huge upside rally.
Technical indicators on the four-hour have turned bullish and continue to issue a strong buy signal.
Pattern Watch
Traders should note that the June 22nd swing-high is the overall upside target of the bullish inverted head and shoulders pattern.
Relative Strength Index
The RSI indicator is bullish on the four-hour time frame, although it is correcting from overbought territory.
MACD Indicator
The MACD indicator is bullish on the four-hour time frame and continues to generate a buy signal.
GXChain / USD Medium-term price analysis
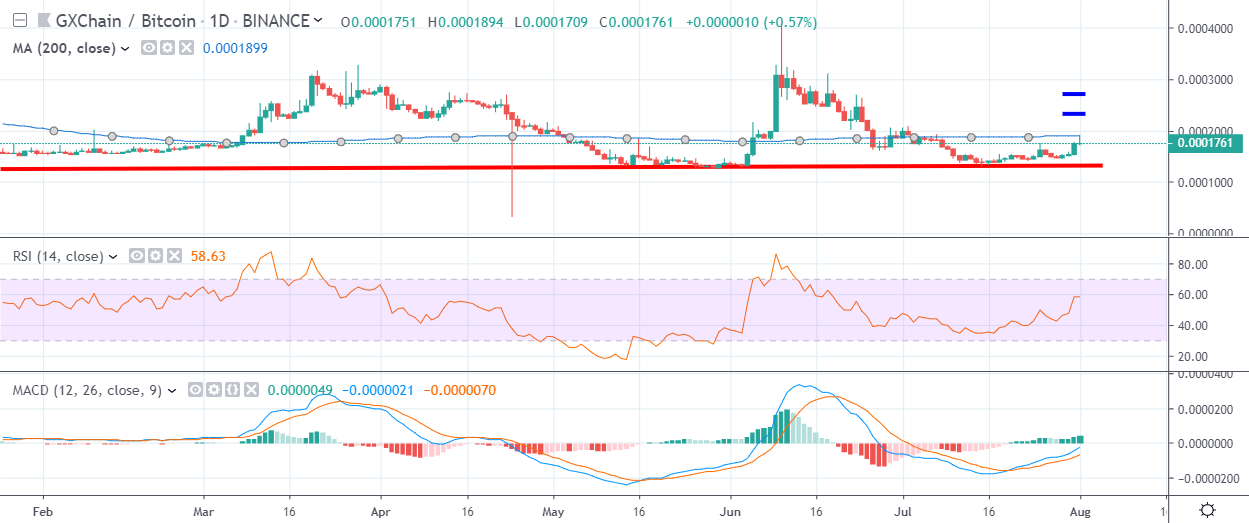
GXChain has a neutral medium-term outlook against Bitcoin, with the GXC / BTC pair testing towards its key 200-day moving average.
The daily time frame is showing that a large head and shoulders pattern is forming, with the GXC / BTC pair recovering from the neckline of the bearish pattern.
Technical indicators on the daily frame have turned bullish and continue to issue strong buy signals.
Pattern Watch
Traders should note that a complex head and shoulders pattern may be forming on the daily time frame.
Relative Strength Index
The RSI indicator is rising on the daily time frame and shows scope for further upside.
MACD Indicator
The MACD indicator is turning bullish on the daily time frame and is issuing a strong buy signal.
Conclusion
GXChain is on the move against Bitcoin, with the four-hour time frame highlighting that a major bullish breakout in the GXC / BTC pair is on the horizon.
The GXC / BTC pair’s medium-term bias may also be about to shift, although the daily time frame is showing that any moves higher may just be corrective in nature.
Check out our coin guide for a quick introduction to GXChain.
Share this article
