 Earn with Nexo

ICX / USD Price Analysis: Important Test
Bulls will need to work hard to put the pair into a solidly positive outlook.
- ICON retains a bullish short-term outlook, with the cryptocurrency still trading above its 200-period moving average on the four-hour time frame
- The four-hour time frame also shows price pressing towards the neckline of bullish inverted head and shoulders pattern
- The medium-term time frame is neutral, with the ICX / USD pair trading at the top of its price range on the daily time frame
ICX / USD Short-term price analysis
ICON has a bullish outlook over the short-term, with the ICX / USD pair attempting to move back towards its current 2019 trading high.
The four-hour time frame shows that a head and shoulders pattern has started to take shape, with bulls now trying to invalidate the bearish pattern.
Technical indicators on the four-hour time frame have turned bullish and highlight the growing short-term upside pressure.
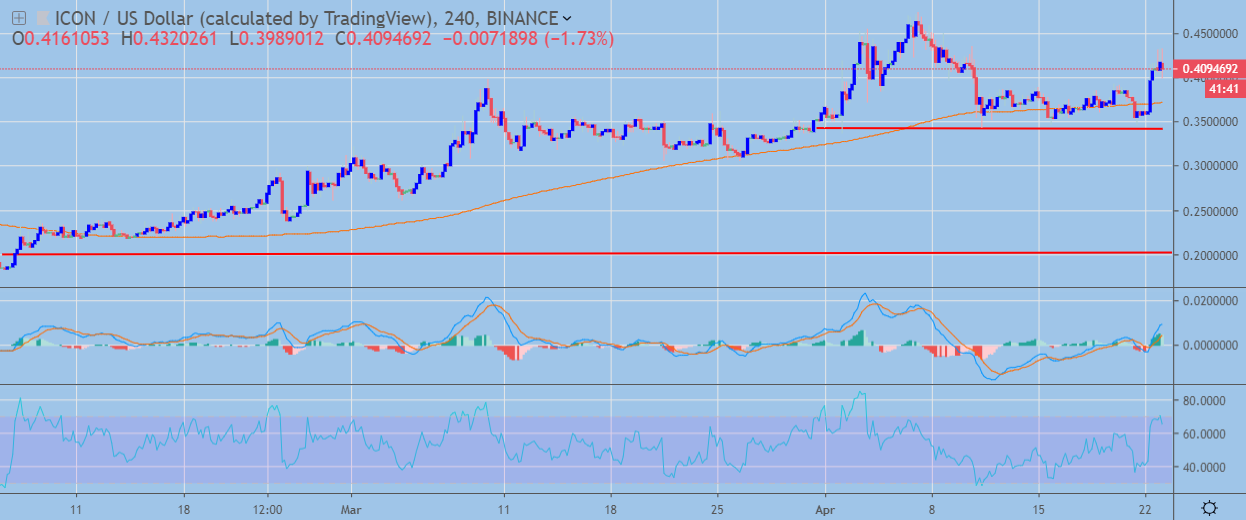 ICX / USD H4 Chart by TradingView
Pattern Watch
If the bearish head and shoulders pattern is triggered, the ICX / USD pair could fall back towards the February 2019 trading low.
Relative Strength Index
The RSI indicator has also turned bullish on the four-hour time frame, although it is approaching overbought conditions.
MACD Indicator
The MACD indicator on the four-hour time frame is bullish and generating a buy signal.
Fundamental Analysis
ICX spiked after the announcement of P-Rep TestNet, which will be opening on April 30th. This is an important milestone for the project since it puts ICON one step away from the long-awaited staking. Staking should help the project to further decentralize its nodes and the governance of the network.
ICX / USD Medium-term price analysis
ICON has a bullish medium-term trading outlook, with the cryptocurrency advancing above its trend-defining 200-day moving average.
The daily time frame shows that a bearish head and shoulders pattern has formed. If buyers can invalidate the pattern, the ICX / USD pair may rally towards the November 7th trading high.
Technical indicators on the daily time frame are conflicted and failing to generate clear trading signals.
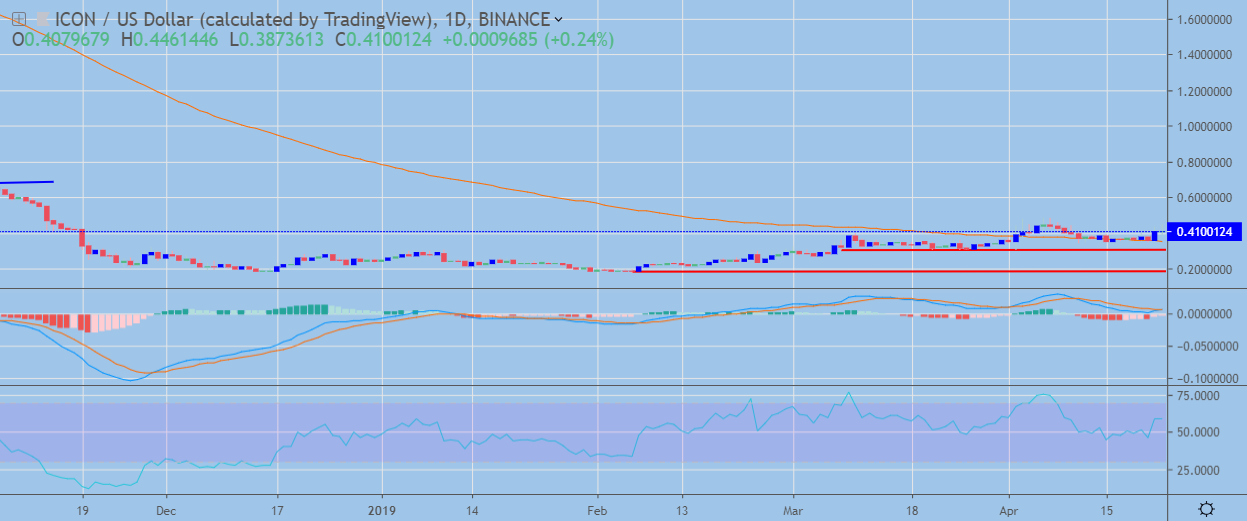 ICX / USD Daily Chart by Trading View
Pattern Watch
Traders should note that a much larger head and shoulders pattern could form on the daily time frame if the ICX / USD pair declines back towards the February trading low.
Relative Strength Index
The RSI indicator on the daily time frame is bullish and shows scope for further upside.
MACD Indicator
The MACD indicator is conflicted on the daily time frame, with the MACD histogram attempting to recover, while the MACD signal line remains bearish.
Fundamental Analysis
The medium-term outlook also looks positive. The platform plans various releases, with the on-chain election in Q4 2019. In addition to that, the project is planning several important initiatives that will expand its ecosystem, such as a dApp accelerator program, decentralized exchange, and decentralized identification.
Conclusion
ICON faces a crucial test over both the short and medium-term horizon, with buyers needing to invalidate the bearish head and shoulders patterns across four-hour and daily time frames.
If bulls invalidate the pattern, a rally towards the November 7th swing-high seems likely, while a bearish breakdown supports technical selling towards the February 2019 swing-low.
For a quick intro into ICON, check out our coin guide.