 Earn with Nexo

Lisk Price Analysis LSK / USD: Technical Crossroads
A decisive moment is ahead, which tunnel will it take?
- Lisk has a bearish short-term outlook, with the cryptocurrency still trading below its 200-period moving average on the four-hour time frame
- The four-hour time frame shows that LSK / USD bulls are attempting to create a bullish inverted head and shoulders pattern
- The daily time frame continues to show a large broadening wedge pattern
Lisk / USD Short-term price analysis
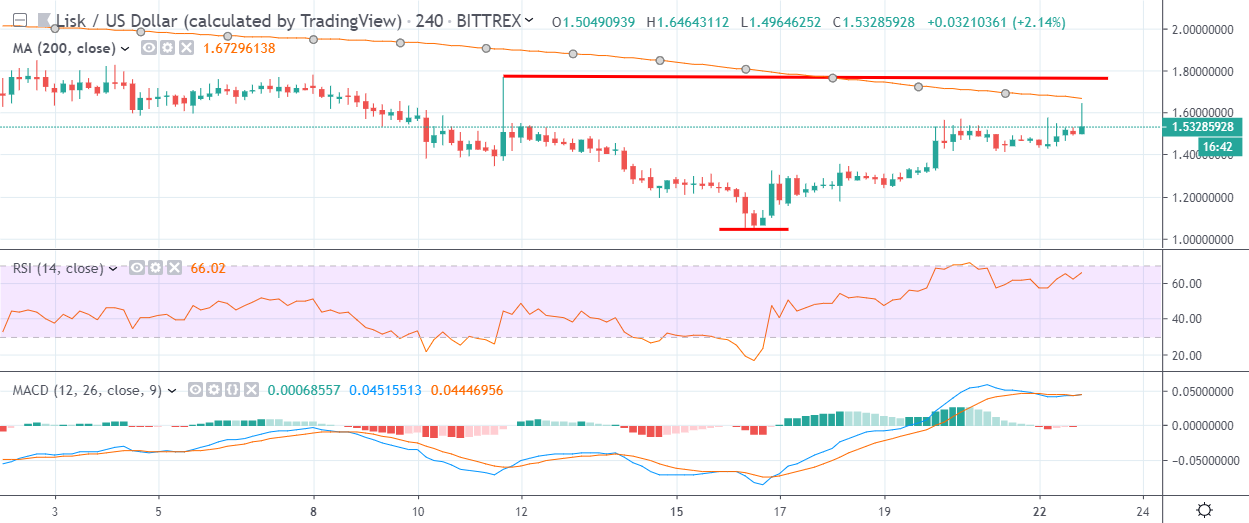
Lisk has a bearish short-term outlook, with the cryptocurrency still trapped below its 200-period moving average on the four-hour time frame.
The four-hour time frame shows that the recent upside recovery in the LSK / USD pair may help to create a large inverted head and shoulders pattern.
Technical indicators on the four-hour time frame are bullish, although they are starting to appear overstretched.
Pattern Watch
Traders should note that failure to create a bullish inverted head and shoulders pattern could provoke heavy short-term technical selling.
Relative Strength Index
The RSI indicator on the four-hour time frame is also bullish, although it has moved into extreme overbought territory.
MACD Indicator
The MACD indicator on the four-hour time frame is bullish, although the MACD signal line and histogram are now overbought.
Lisk / USD Medium-term price analysis
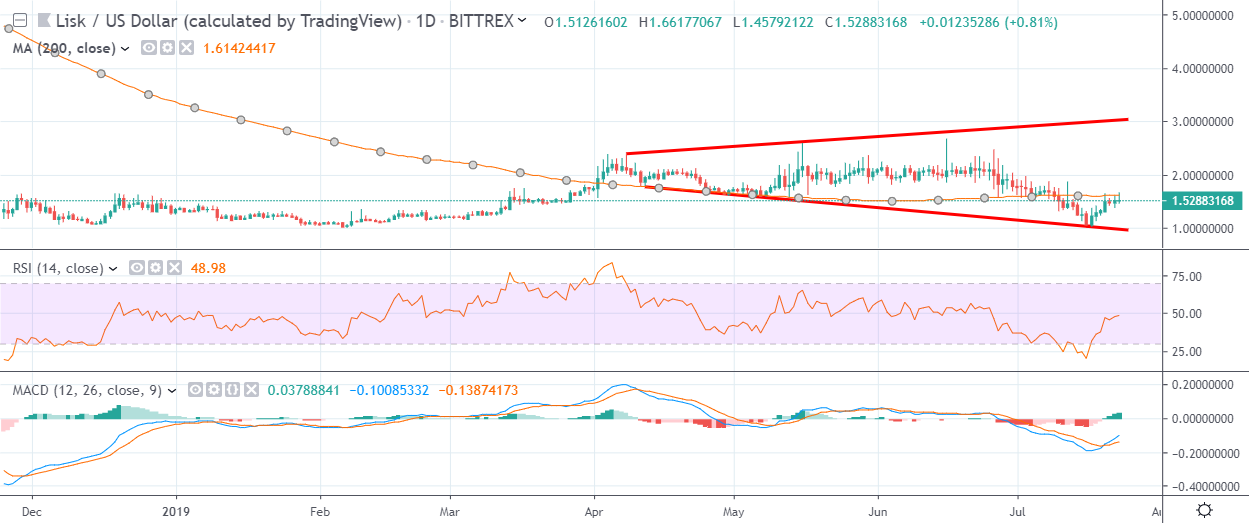
Lisk has a bearish medium-term bias, with the cryptocurrency still trading below its trend defining 200-day moving average.
The daily time frame is showing that a large broadening wedge pattern is still in play, with the LSK / USD pair performing a strong technical bounce from trendline support.
Technical indicators on the daily time frame are attempting to turn bullish, although the buy signal is still relatively weak.
Pattern Watch
Traders should note that broadening wedge patterns are typically considered neutral and usually favor range-bound trading until a confirmed breakout occurs.
Relative Strength Index
The RSI indicator on the daily time frame is neutral and is currently failing to generate a clear trading signal.
MACD Indicator
The MACD indicator on the daily time frame is attempting to turn bullish alongside the recent advance in the LSK / USD pair.
Conclusion
Lisk is approaching a critical juncture over the short-term horizon, with a strong technical rejection or the formation of a large bullish pattern likely to occur.
The medium-term prospects for the LSK / USD pair appear more stable, with the daily time frame pointing to an extended period of range-bound trading ahead.
Check out what Lisk is about in our coin guide.