Lisk Price Analysis LSK / USD: Reaching The Bottom
Downside trend might be wearing off for LSK.

Share this article
- Lisk has a bearish short-term outlook, with the cryptocurrency still trading below its 200-period moving average on the four-hour time frame
- The four-hour time frame shows that a bearish head and shoulders pattern has been triggered
- The daily time frame continues to show a large broadening wedge pattern
Lisk / USD Short-term price analysis
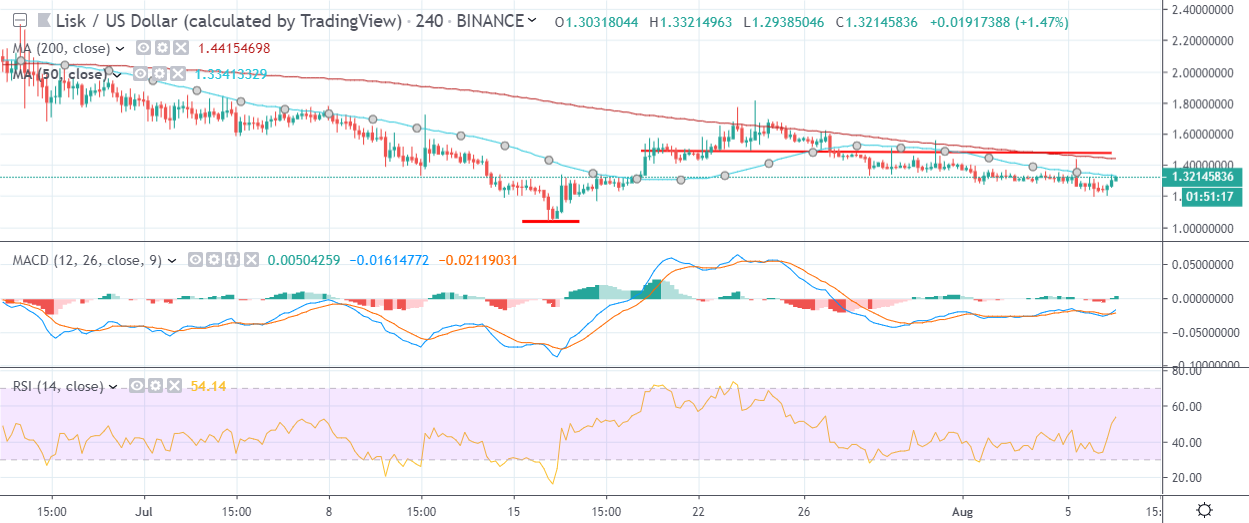
Lisk has a bearish short-term outlook, with the cryptocurrency still trapped below its 200-period moving average on the four-hour time frame.
The four-hour time frame shows that the LSK / USD pair has started to recover towards major short-term resistance after a bearish head and shoulders pattern reached its full downside objective.
Technical indicators on the four-hour time frame have turned bullish and continue to issue a buy signal.
Pattern Watch
Traders should note that a bullish double-bottom may have formed on the four-hour time frame.
Relative Strength Index
The RSI indicator on the four-hour time frame is also bullish and shows scope for further upside.
MACD Indicator
The MACD indicator on the four-hour time frame is bullish, with both the MACD signal line and histogram issuing buy signals.
Lisk / USD Medium-term price analysis
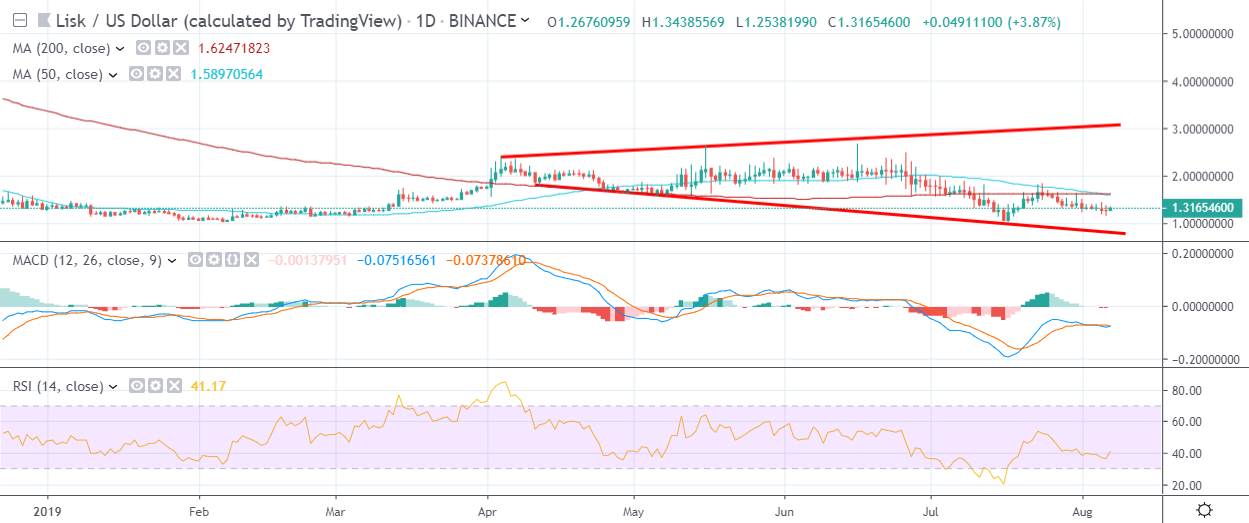
Lisk has a bearish medium-term bias, with the cryptocurrency remaining below its trend defining 200-day moving average.
The daily time frame continues to show a broadening wedge pattern, which may signify an extended period of price consolidation inside the neutral pattern.
Technical indicators on the daily time frame are still bearish, despite the recent bounce in the LSK / USD pair.
Pattern Watch
Traders should note that broadening wedge patterns are typically considered neutral and usually favor range-bound trading until a breakout occurs.
Relative Strength Index
The RSI indicator on the daily time frame is attempting to recover higher, although it remains technically bearish.
MACD Indicator
The MACD indicator on the daily time frame is neutral and is failing to issue a clear trading signal.
Conclusion
Lisk is showing signs of possible downside exhaustion, with the recent short-term rebound highlighting that LSK / USD bulls may be sensing that price floor has been found.
Traders should be on guard for a potential double-bottom forming and price stabilization above the cryptocurrencies 200-day moving average.
Check out what Lisk is about in our coin guide.
Share this article
