Lisk Price Analysis LSK / USD: Shock Therapy
LSK has experienced its worst one-day decline since mid-July.

Share this article
- Lisk has a bearish short-term outlook, with the cryptocurrency suffering a severe double-digit intraday decline
- The four-hour time frame shows that a bearish head and shoulders pattern is close to reaching its downside target
- The daily time frame shows that the LSK / USD pair is approaching the bottom of a broadening wedge pattern
Lisk / USD Short-term price analysis
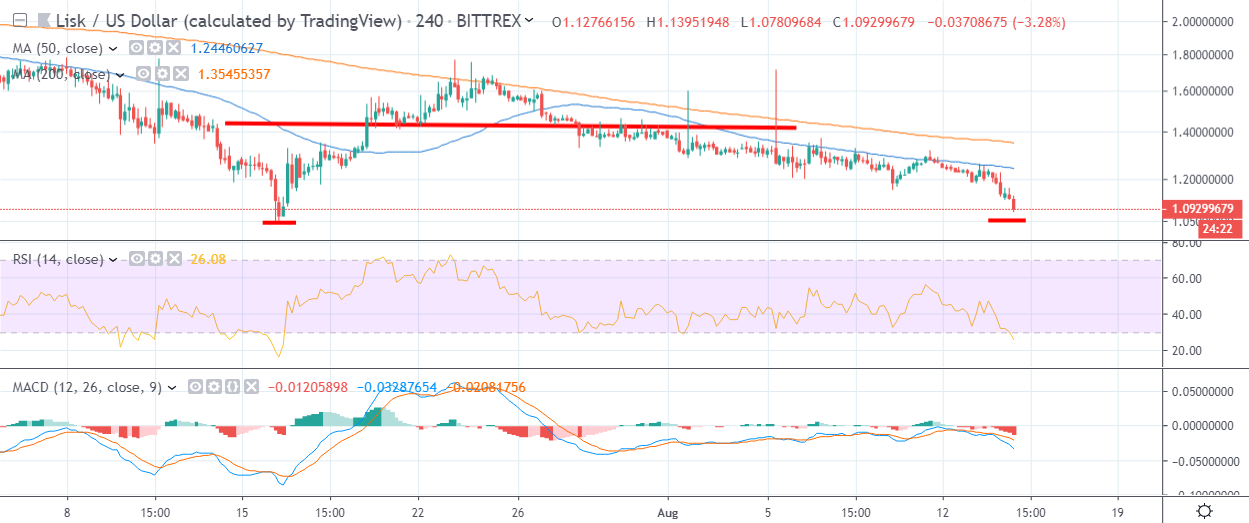
Lisk has an increasingly bearish short-term outlook, with the cryptocurrency suffering a severe double-digit intraday decline.
The four-hour time frame shows that a bearish head and shoulders pattern is continuing to play out to the downside. It is worth mentioning that the bearish pattern is close to reaching its overall downside objective.
Technical indicators on the four-hour time frame have turned bearish and continue to issue strong sell signals.
Pattern Watch
Traders should note that a bullish double-bottom pattern may form on the four-hour time frame if the July monthly trading low holds.
Relative Strength Index
The RSI indicator on the four-hour time frame is also bearish, although it is approaching oversold conditions.
MACD Indicator
The MACD indicator on the four-hour time frame is bearish, with both the MACD signal line and histogram issuing sell signals.
Lisk / USD Medium-term price analysis
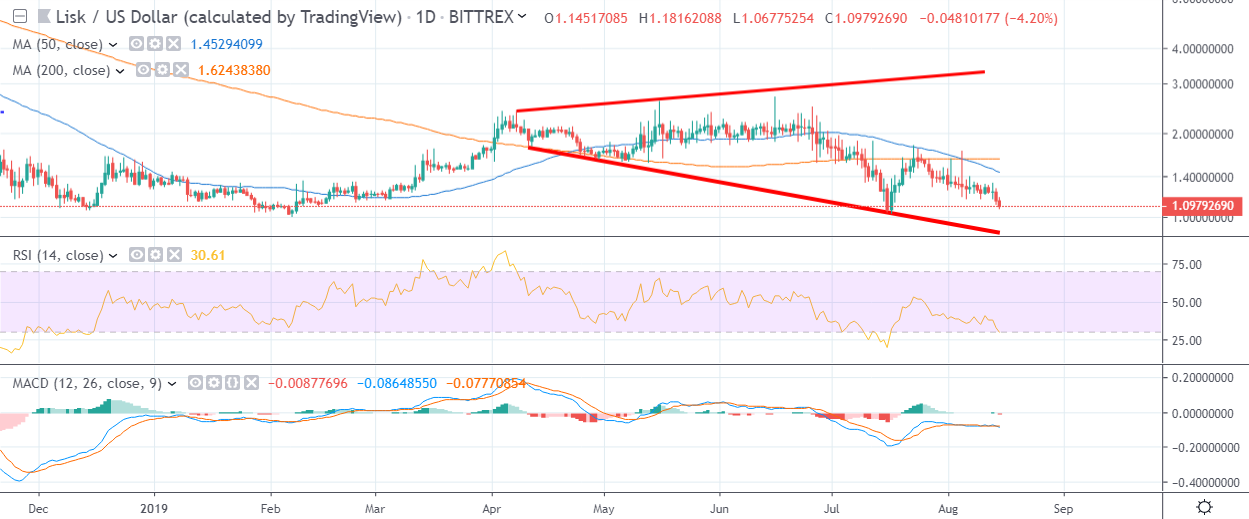
Lisk has a bearish medium-term bias, with the 50-day moving average crossing over the 200-day moving average on the daily time frame.
The daily time frame continues to show a large broadening wedge pattern, with the LSK / USD pair falling towards the bottom of the neutral price pattern.
Technical indicators on the daily time remain bearish and are starting to roll-over.
Pattern Watch
Traders should note that broadening wedge patterns are typically considered neutral and usually favor range-bound trading inside the pattern until a breakout occurs.
Relative Strength Index
The RSI indicator on the daily time frame is bearish and continues to issue a strong sell signal.
MACD Indicator
The MACD indicator on the daily time frame is starting to turn lower, although the sell signal is still weak.
Conclusion
Lisk continues to break to the downside, with the cryptocurrency suffering its worst one-day decline since mid-July.
The bearish moving average crossover indicates that the cryptocurrency is increasingly likely to test towards the bottom of the huge broadening wedge pattern on the daily time frame.
Check out what Lisk is about in our coin guide.
Share this article
