LSK / USD Price Analysis: Under Siege
The daily-time frame is providing support for Lisk, but it will need to make a recovery soon.

Share this article
- Lisk is bearish in the short-term, with the cryptocurrency still trading below its 200-period moving average on the four-hour time frame
- The medium-term trading outlook for the LSK / USD pair remains bullish
- The daily time frame continues to show a bullish inverted head and shoulders pattern
Lisk / USD Short-term price analysis
LSK has a bearish short-term outlook, with the cryptocurrency still trading below its 200-period moving average on the four-hour time frame.
The four-hour time frame shows a valid head and shoulders pattern, with LSK / USD buyers now attempting to reverse the recent decline and invalidate the bearish pattern.
Technical indicators are still bullish on the four-hour time frame and continue to signal further near-term gains.
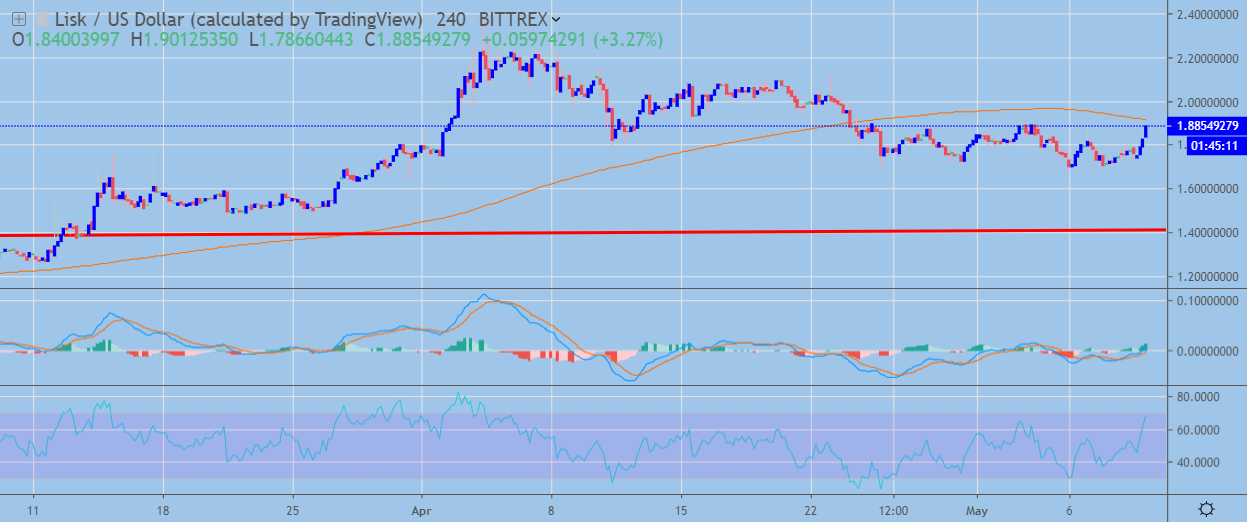 LSK / USD H4 Chart by TradingView
Pattern Watch
Traders should note that a much larger bearish head and shoulders pattern could take shape if the LSK / USD pair starts to decline.
Relative Strength Index
The RSI indicator on the four-hour time frame is bullish, although it has moved into overbought territory.
MACD Indicator
The MACD indicator on the four-hour time frame has turned bullish, with the MACD signal line and histogram issuing a buy signal.
Lisk / USD Medium-term price analysis
LSK has a bullish medium-term outlook, with the cryptocurrency still trading above its trend defining 200-day moving average.
The daily time frame is showing that the inverted head and shoulders pattern has reached its upside target, with LSK / USD bulls now needing to force price above the current 2019 trading high to encourage fresh technical buying.
Technical indicators on the daily time frame are attempting to turn bullish alongside the recent advance in the LSK / USD pair.
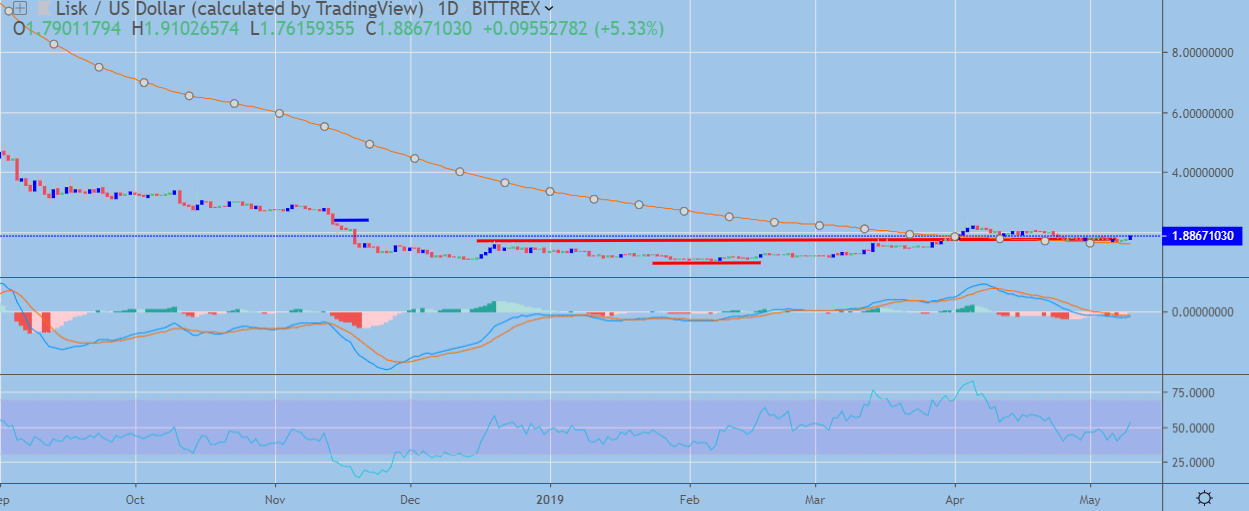 LSK / USD Daily Chart by TradingView
Pattern Watch
Traders should note that a bearish head and shoulders pattern could form on the daily time frame if buyers fail to move the LSK / USD pair to a new 2019 trading high.
Relative Strength Index
The RSI indicator on the daily time frame has turned bullish as upside momentum continues to build.
MACD Indicator
The MACD indicator on the daily time frame is attempting to turn bullish alongside the recent advance in the LSK / USD pair.
Conclusion
LSK is attempting to build bullish momentum over both time horizons after finding strong technical support from its 200-day moving average.
If sellers fail to invalidate the bearish pattern on the four-hour time frame, the LSK / USD pair could suffer even deeper losses and turn bearish over the medium-term.
Check out our coin guide for Lisk.
Share this article
