NEO Flashes Buy Signal as Crypto Market Turns Bullish
NEO looks ready to join Bitcoin’s bull party after flashing a buy signal above a critical support barrier.
After falling by 38% over the past month, NEO looks ready to regain lost ground. Multiple technical indexes suggest that buyers are reemerging as this sunken token heads for greener pastures.
NEO Ready to Surge
While Bitcoin leads the newest bull cycle in the cryptocurrency market, NEO looks ready to catch up.
The TD sequential indicator presented a buy signal on the 12-hour chart, suggesting that momentum is building for an upswing. The bullish formation developed in the form of a red nine candlestick.
If validated by a spike in buying pressure, NEO could rise for one to four 12-hour candlesticks or begin a new upward countdown.
But first, NEO would have to break above the 50-twelve-hour moving average, which is currently serving as a stiff resistance.
Turning this hurdle into support will increase the odds for a further advance towards the next area of interest, around the 100-twelve-hour moving average. This trend-following indicator is hovering at $19.
Given the massive rally that Bitcoin is going through, it is reasonable to assume that NEO may also experience an explosive price action.
If the $19 hurdle is out of the way, prices could rise towards the setup trendline at $22.5.
Investors Grow Overwhelmingly Bullish
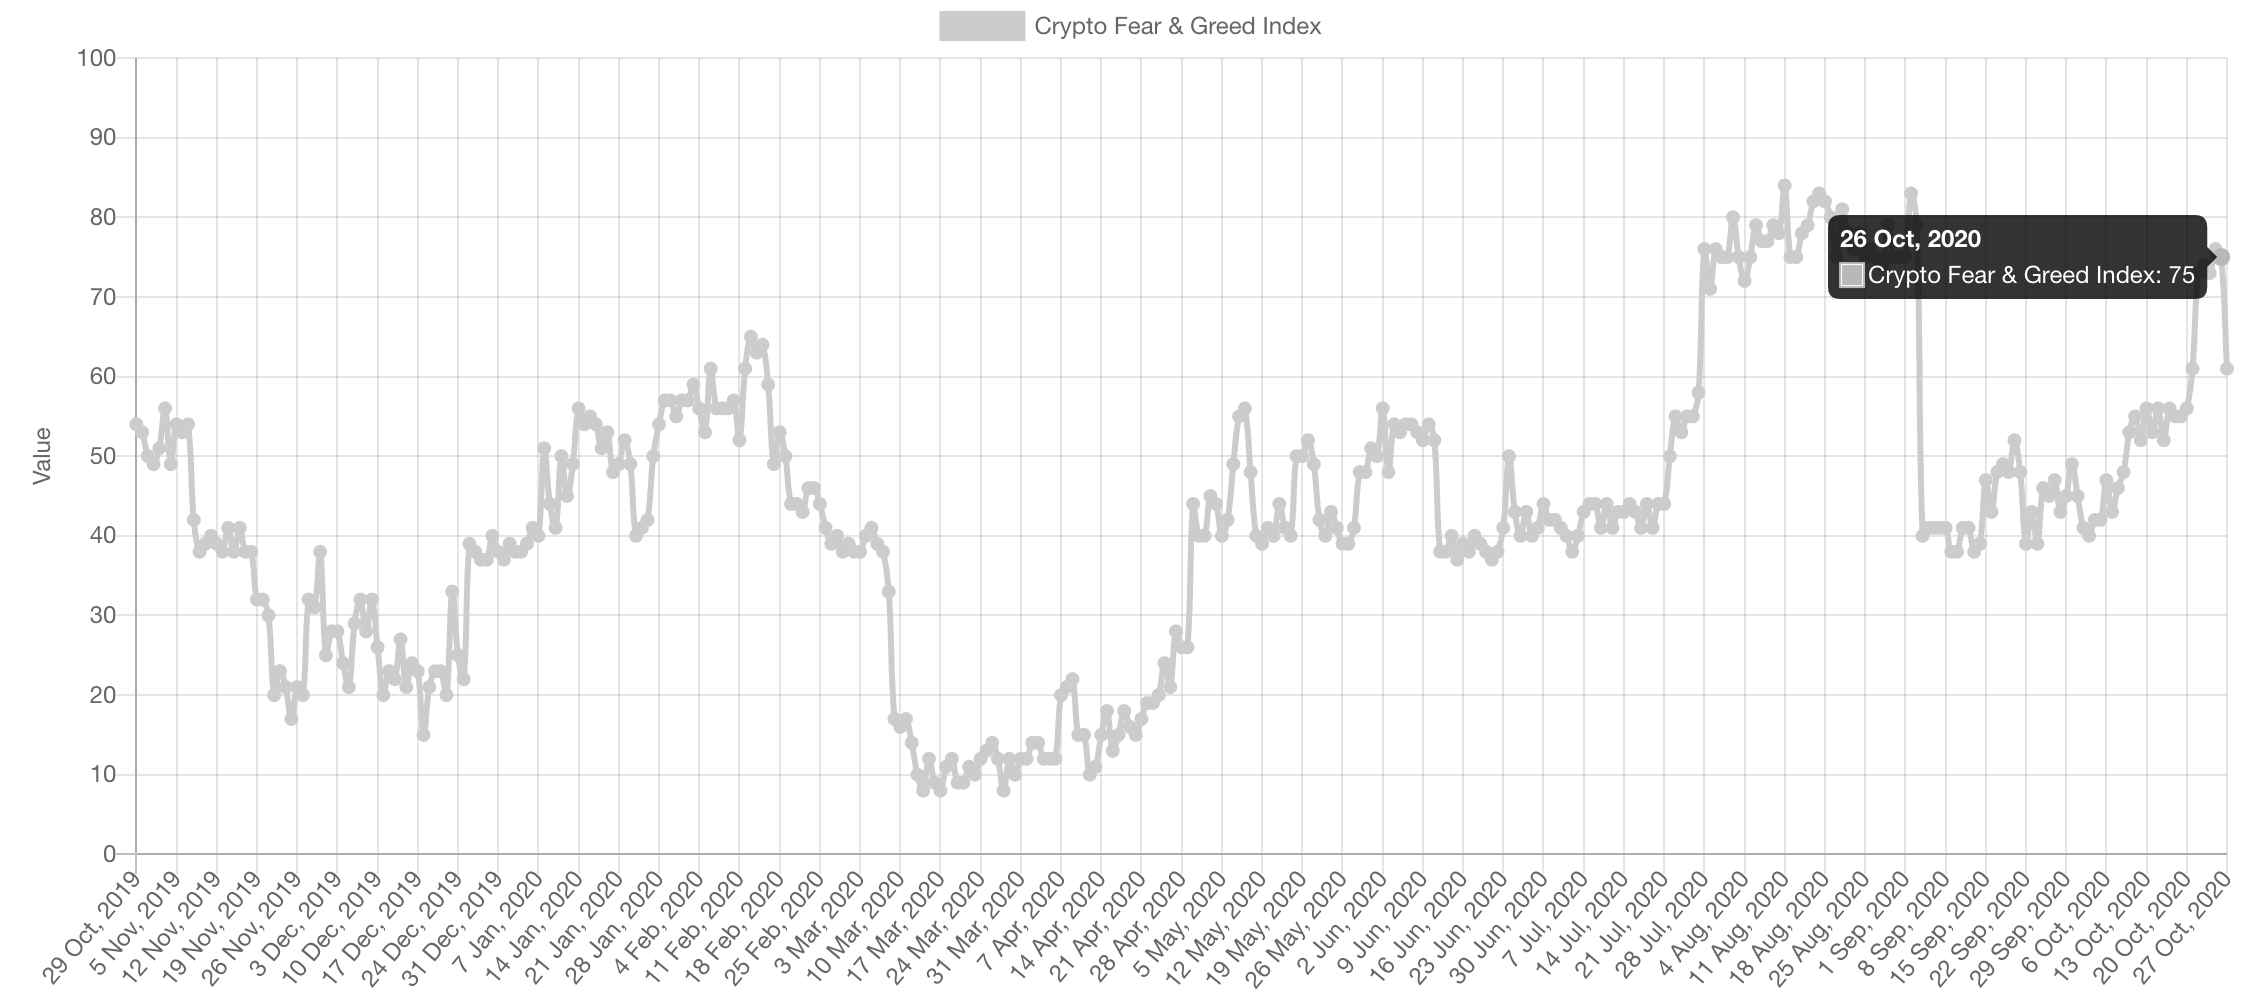
It is worth noting that greed currently dominates the sector, according to the Crypto Fear and Greed Index. Based on the CFGI, when investors grow overwhelmingly bullish, a steep correction follows.
Historically, this fundamental index has been incredibly accurate at anticipating downturns in the market.
For instance, NEO took a 30% nosedive in early September after the CFGI went into “extreme greed.” A similar event happened in February, which was succeeded by a massive 76% correction.
Therefore, investors must pay close attention to the 200-twelve-hour moving average on NEO’s 12-hour chart.
A sudden spike in selling pressure that pushes prices below this crucial support level will likely invalidate the bullish outlook. Under such circumstances, this cryptocurrency may drop to the next significant support barrier, around $13.