
OmiseGo Price Analysis OMG / USD: Burning The Stash
A token burn gave some strength to the token's short-term prospects.
- OmiseGo has a bullish short-term bias, with the cryptocurrency rallying to a fresh 2019 trading high
- The four-hour time frame shows the OMG / USD pair has invalidated a bearish pattern
- The daily time frame time highlights that bulls are attempting a major technical breakout
Fundamental Analysis
OmiseGo has gained momentum after GO.Exchange announced that it is planning to use its profits to burn OMG tokens. GO.Exchange is a new blockchain project from OmiseGo team, and it marks a major milestone for the OmiseGo ecosystem.
OmiseGo / USD Short-term price analysis
OmiseGo has a bullish short-term bias, with the cryptocurrency performing a bullish breakout on the four-hour time frame.
The four-hour time frame shows that OMG / USD bulls have invalidated a head and shoulders pattern, with price now testing back towards the head of the bearish pattern.
Technical indicators on the four-hour time frame are bullish and continue to issue a buy signal.
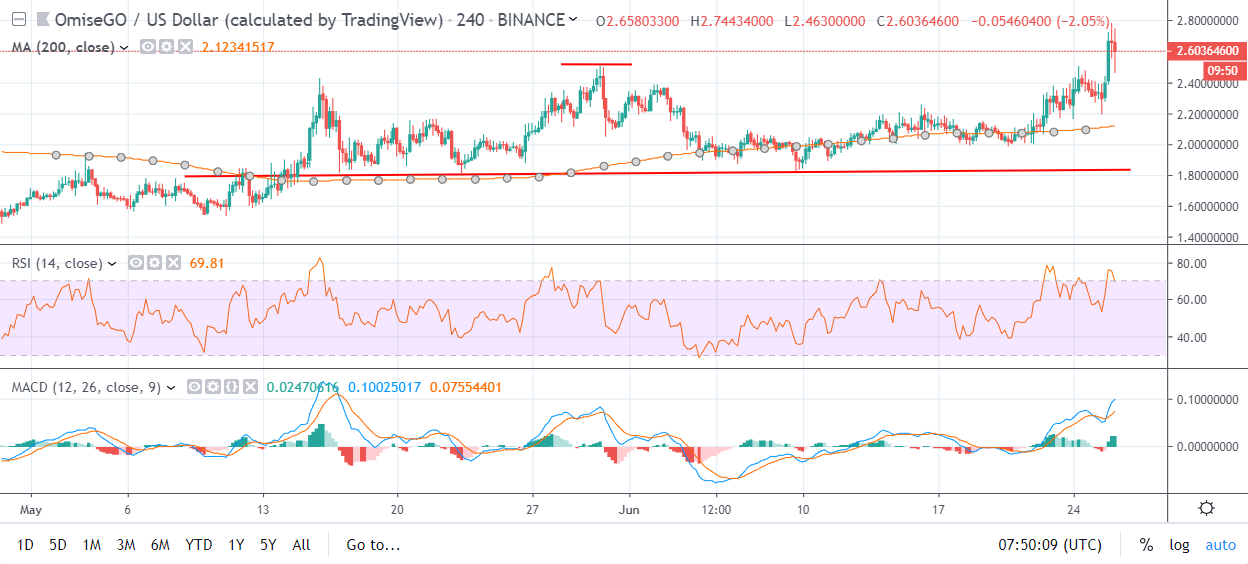
Pattern Watch
Traders should note that the upside target of the invalidate bearish and shoulders pattern is located at the November 14th, 2018 swing-high.
Relative Strength Index
The RSI indicator on the four-hour time frame is bullish, although it is now extremely overbought.
MACD Indicator
The MACD indicator on the four-hour time frame is bullish and continues to issue a buy signal.
OmiseGo / USD Medium-term price analysis
OmiseGo has a bullish medium-term trading bias, with the cryptocurrency attempting a major breakout on the daily time frame.
The daily time frame is showing that OMG / USD bulls are trying to ignite a bullish inverted head and shoulders pattern. The attempted bullish breakout has so far proved unsuccessful, with price slipping back towards neckline support.
Technical indicators across the daily time frame are bullish and continue to issue a buy signal.
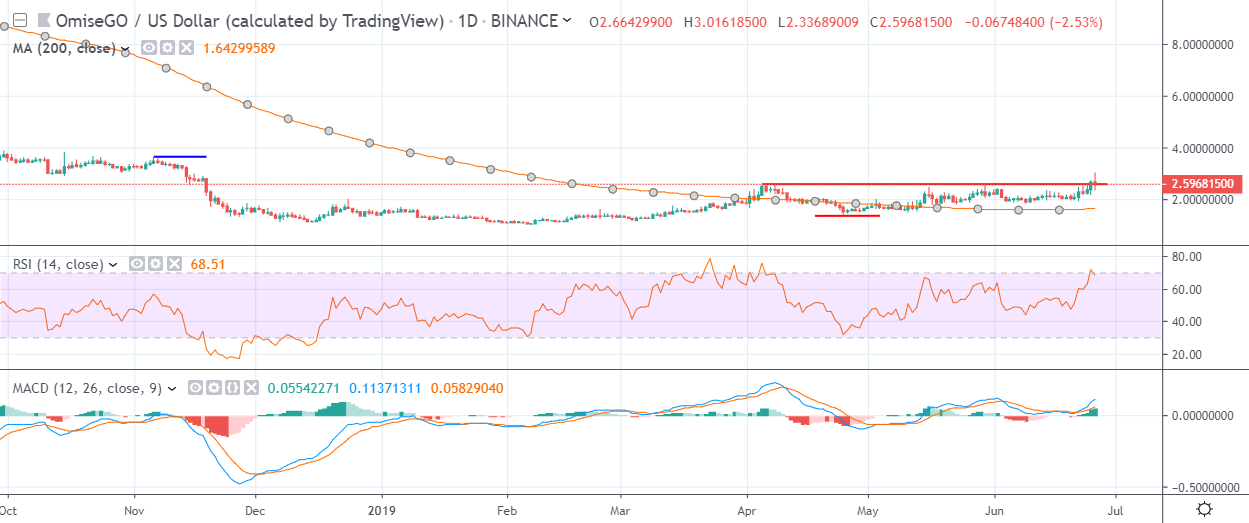
Pattern Watch
Traders should note that the November 2018 trading high is the overall upside target of the bullish pattern on the daily time frame.
Relative Strength Index
The RSI indicator is also bullish on the daily time frame, although it is correcting from overbought conditions.
MACD Indicator
The MACD indicator is bullish on the daily time frame and continues to issue a buy signal.
Conclusion
OmiseGo bulls have successfully invalidated a bearish head and shoulders pattern on the four-hour time frame, opening-the-door for further short-term gains.
Medium-term bulls now need to ignite the large bullish pattern on the daily time frame or they risk the prospect of a failed technical breakout.
Check out the OmiseGo coin guide.