OmiseGo Price Analysis OMG / USD: Go, But Where?
Contrasting patterns paint a confused picture.

Share this article
- OmiseGo has a bullish short-term bias, with the cryptocurrency recovering above its 200-period moving average on the four-hour time frame
- The OMG / USD pair has a bullish medium-term outlook and is trading back above its 200-day moving average
- The daily time frame time shows a large ascending triangle pattern
OmiseGo / USD Short-term price analysis
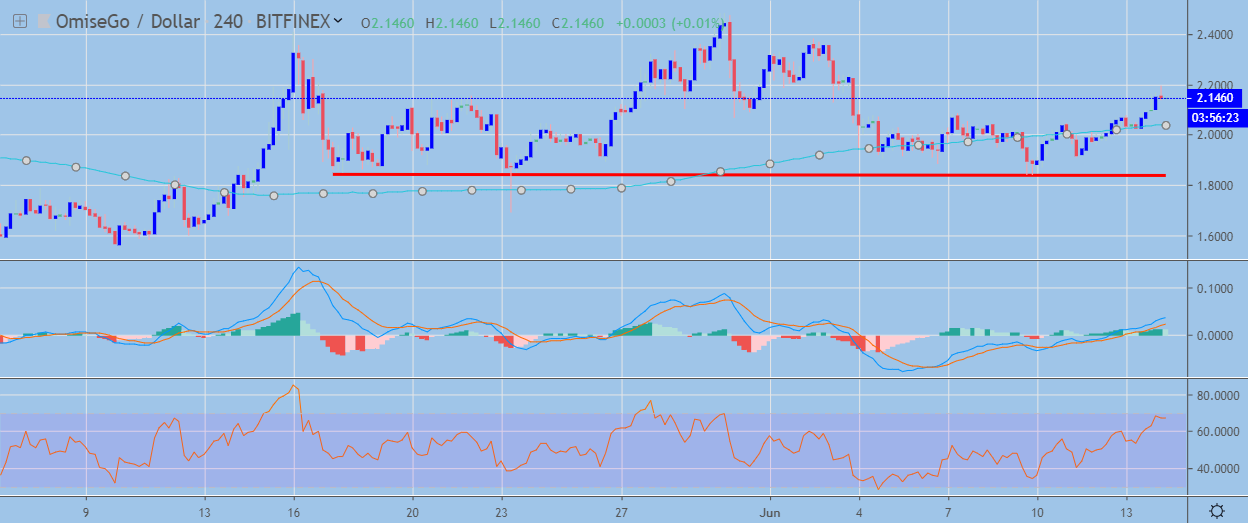
OmiseGo has a bullish short-term bias, with the cryptocurrency recovering back above its 200-period moving average on the four-hour time frame.
The four-hour time frame is showing that a complex head and shoulders pattern is building, with the bearish pattern warning of a much stronger downside move to come.
Technical indicators on the four-hour time frame have turned bullish and continue to issue a buy signal.
Pattern Watch
Traders should note that the downside projection of the bearish head and shoulders pattern would take the OMG / USD pair toward the April 2019 trading low.
Relative Strength Index
The RSI indicator on the four-hour time frame is bullish, although it is approaching overbought conditions.
MACD Indicator
The MACD indicator on the four-hour time frame has turned bullish and continues to issue a buy signal.
OmiseGo / USD Medium-term price analysis
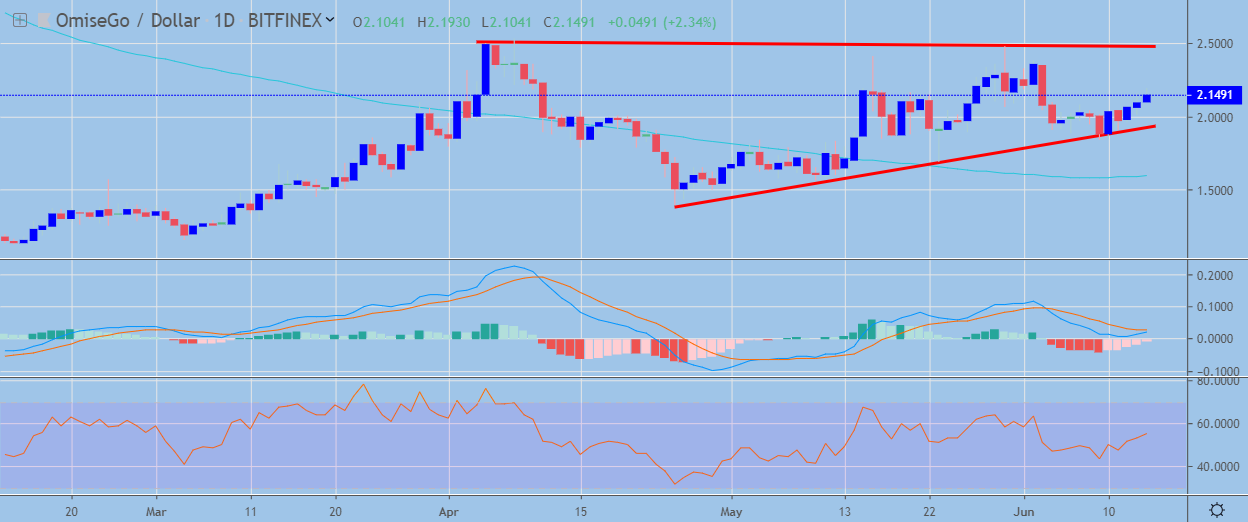
OmiseGo has a bullish medium-term trading outlook, with the cryptocurrency holding price well above its 200-day moving average.
The daily time frame is showing that a bullish ascending triangle pattern has formed, with the OMG / USD pair performing a strong technical bounce from key trendline support.
Technical indicators across the daily time frame are attempting to turn bullish.
Pattern Watch
Traders should note that a bullish breakout from the ascending triangle pattern on the daily time frame would take the OMG / USD pair towards the November 15th trading high.
Relative Strength Index
The RSI indicator has turned bullish on the daily time frame and is starting to generate a buy signal.
MACD Indicator
The MACD indicator is attempting to turn bullish on the daily time frame as medium-term buying pressures build.
Conclusion
OmiseGo is attempting to recover bullish momentum across both time frames after eroding its hard-fought early month trading gains.
The four-hour and daily time frames are currently showing contrasting patterns, which further underscores the indecisiveness towards the cryptocurrency, following the strong early month sell-off.
Check out the OmiseGo coin guide.
Share this article
