
Shutterstock cover by photostock360
Oracle Tokens Chainlink, Band Rebound and Take Flight
Chainlink and Band Protocol have bounced off crucial support levels, which may help them regain lost ground.
The most prominent decentralized oracle tokens in the cryptocurrency market, Chainlink and Band Protocol, look ready to resume their respective uptrends.
While LINK aims for previous all-time highs, BAND is bound for a 60% bull rally.
Chainlink Regains Crucial Support Barrier
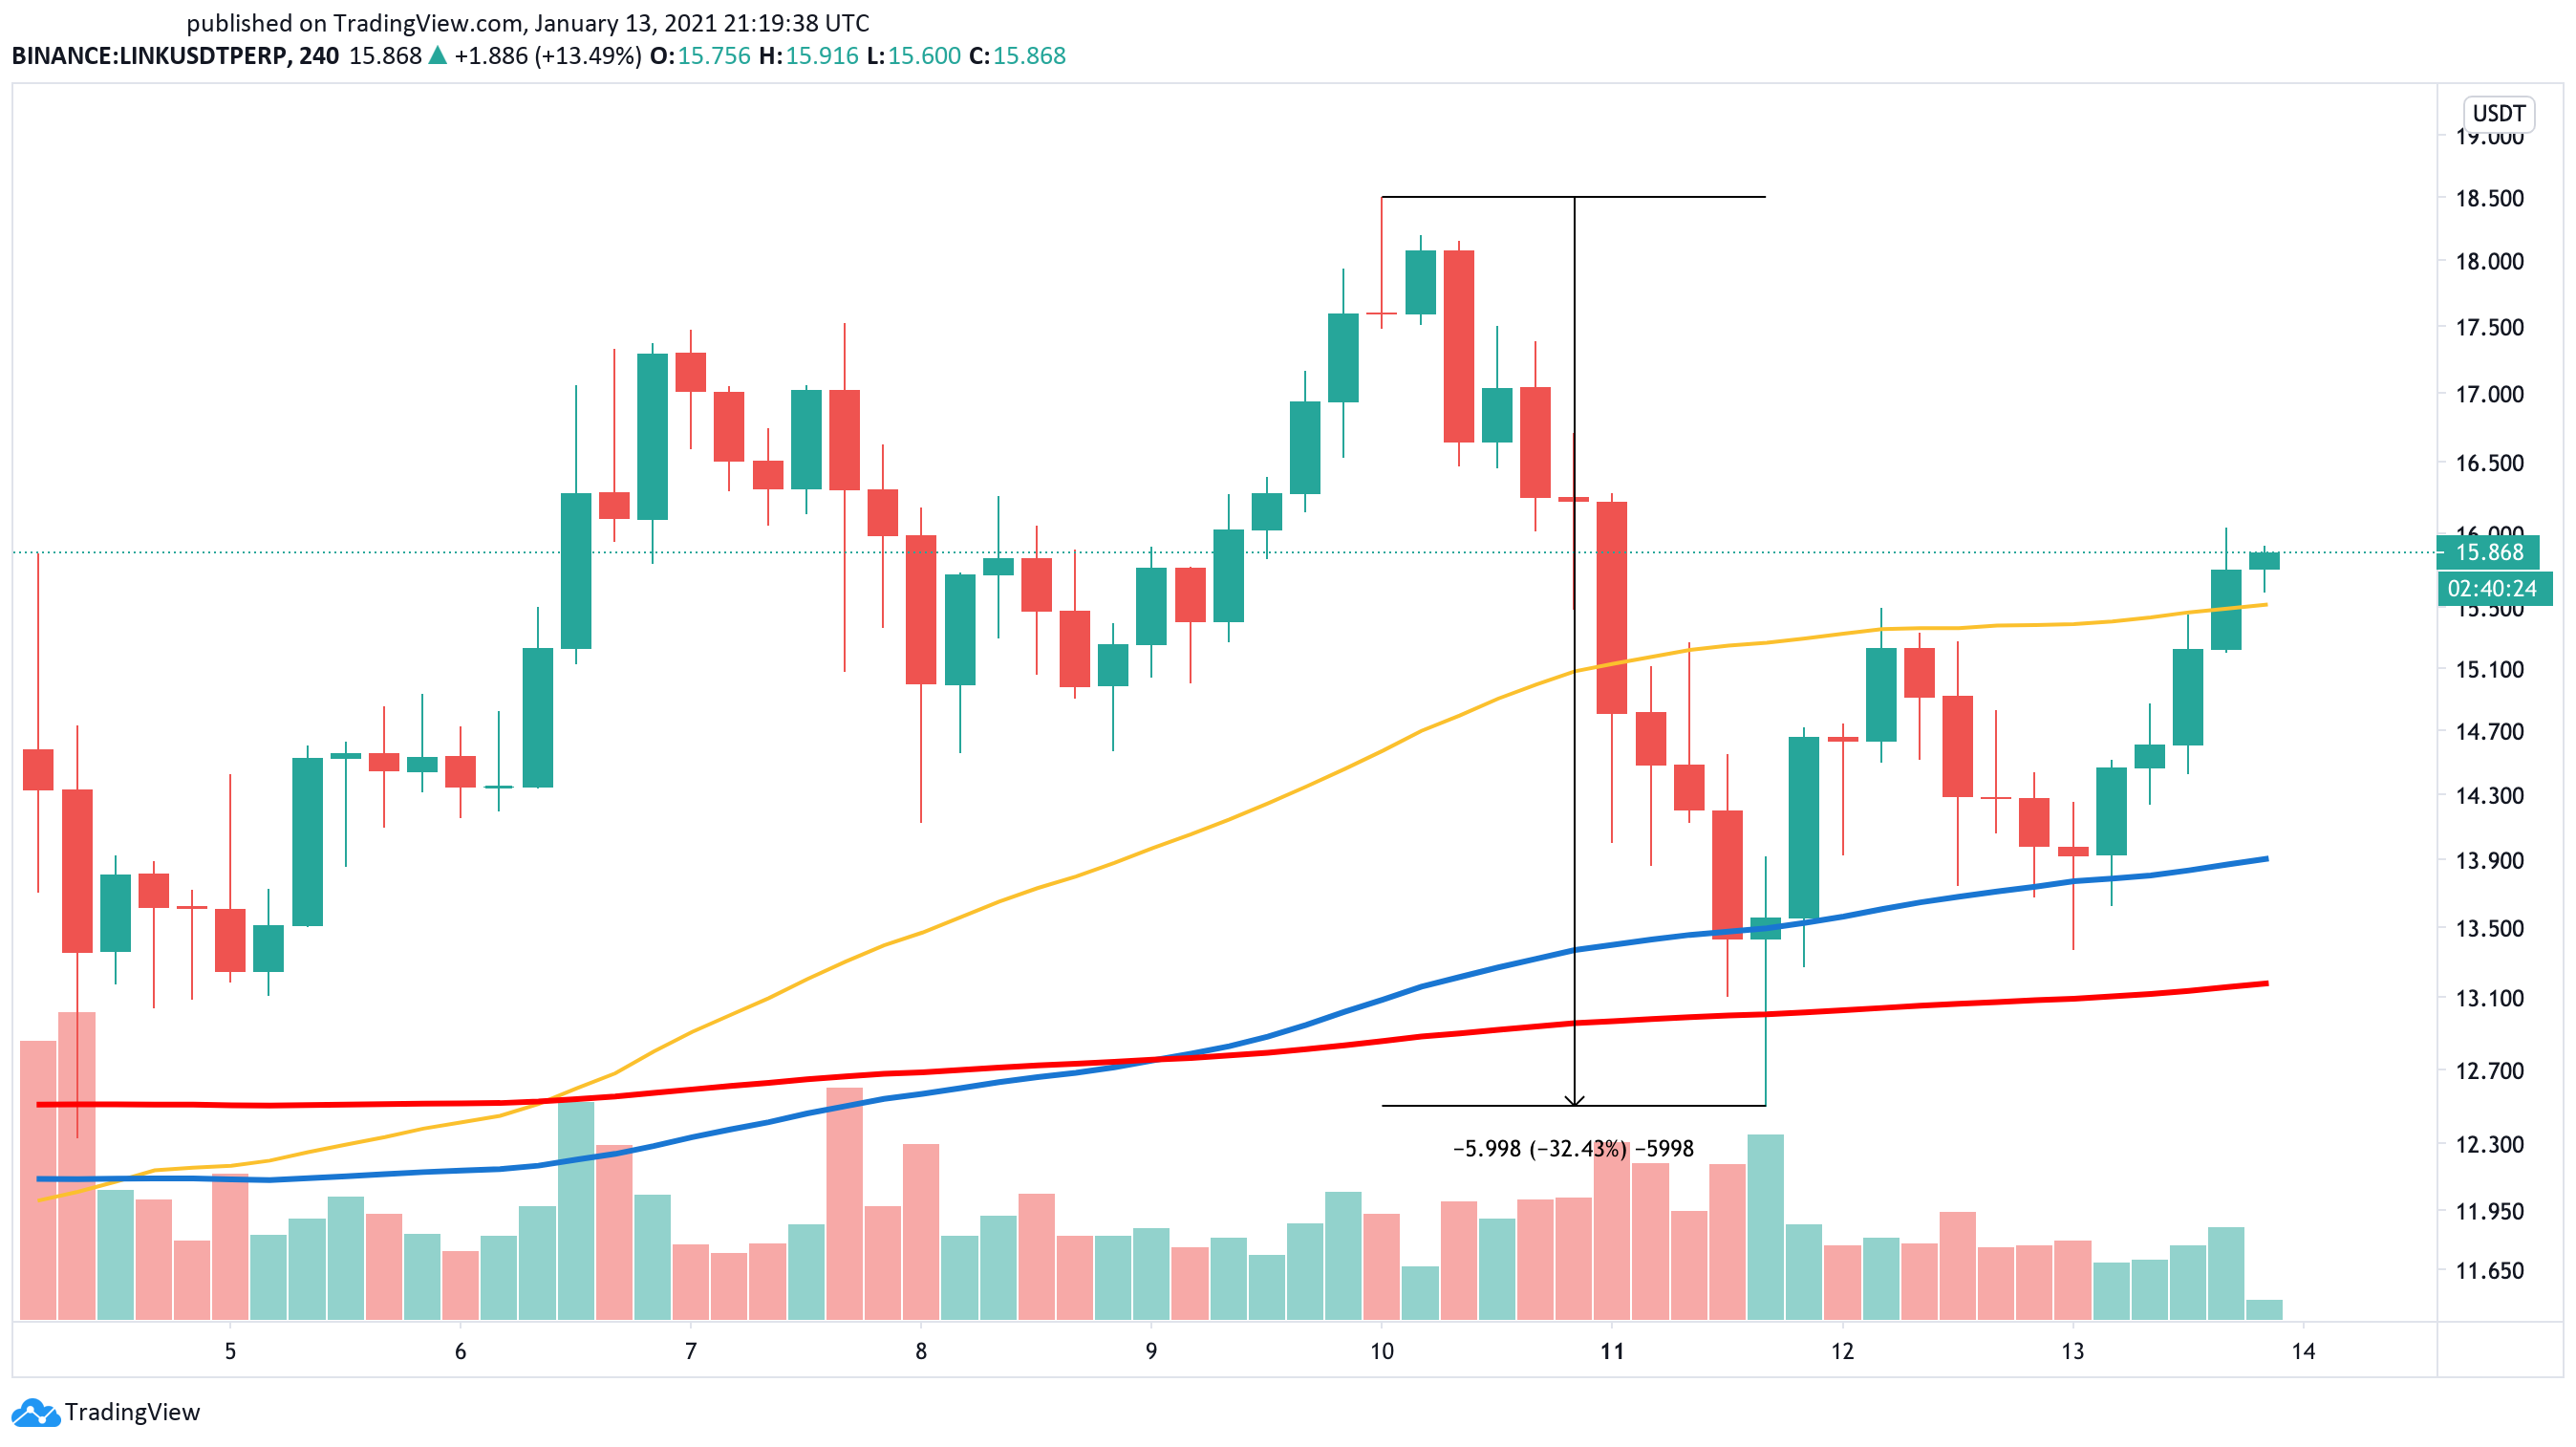
Chainlink suffered a steep correction on Jan. 10 that saw its price drop by more than 30%. It went from trading at a high of $18.50 to hit a low of $12.50 in less than 24 hours.
From a technical perspective, the 200-day moving average on the 4-hour chart was able to act as stiff support and keep falling prices at bay. A spike in buy orders around this demand barrier was significant enough to push LINK back up and regain the 50-day moving average as support.
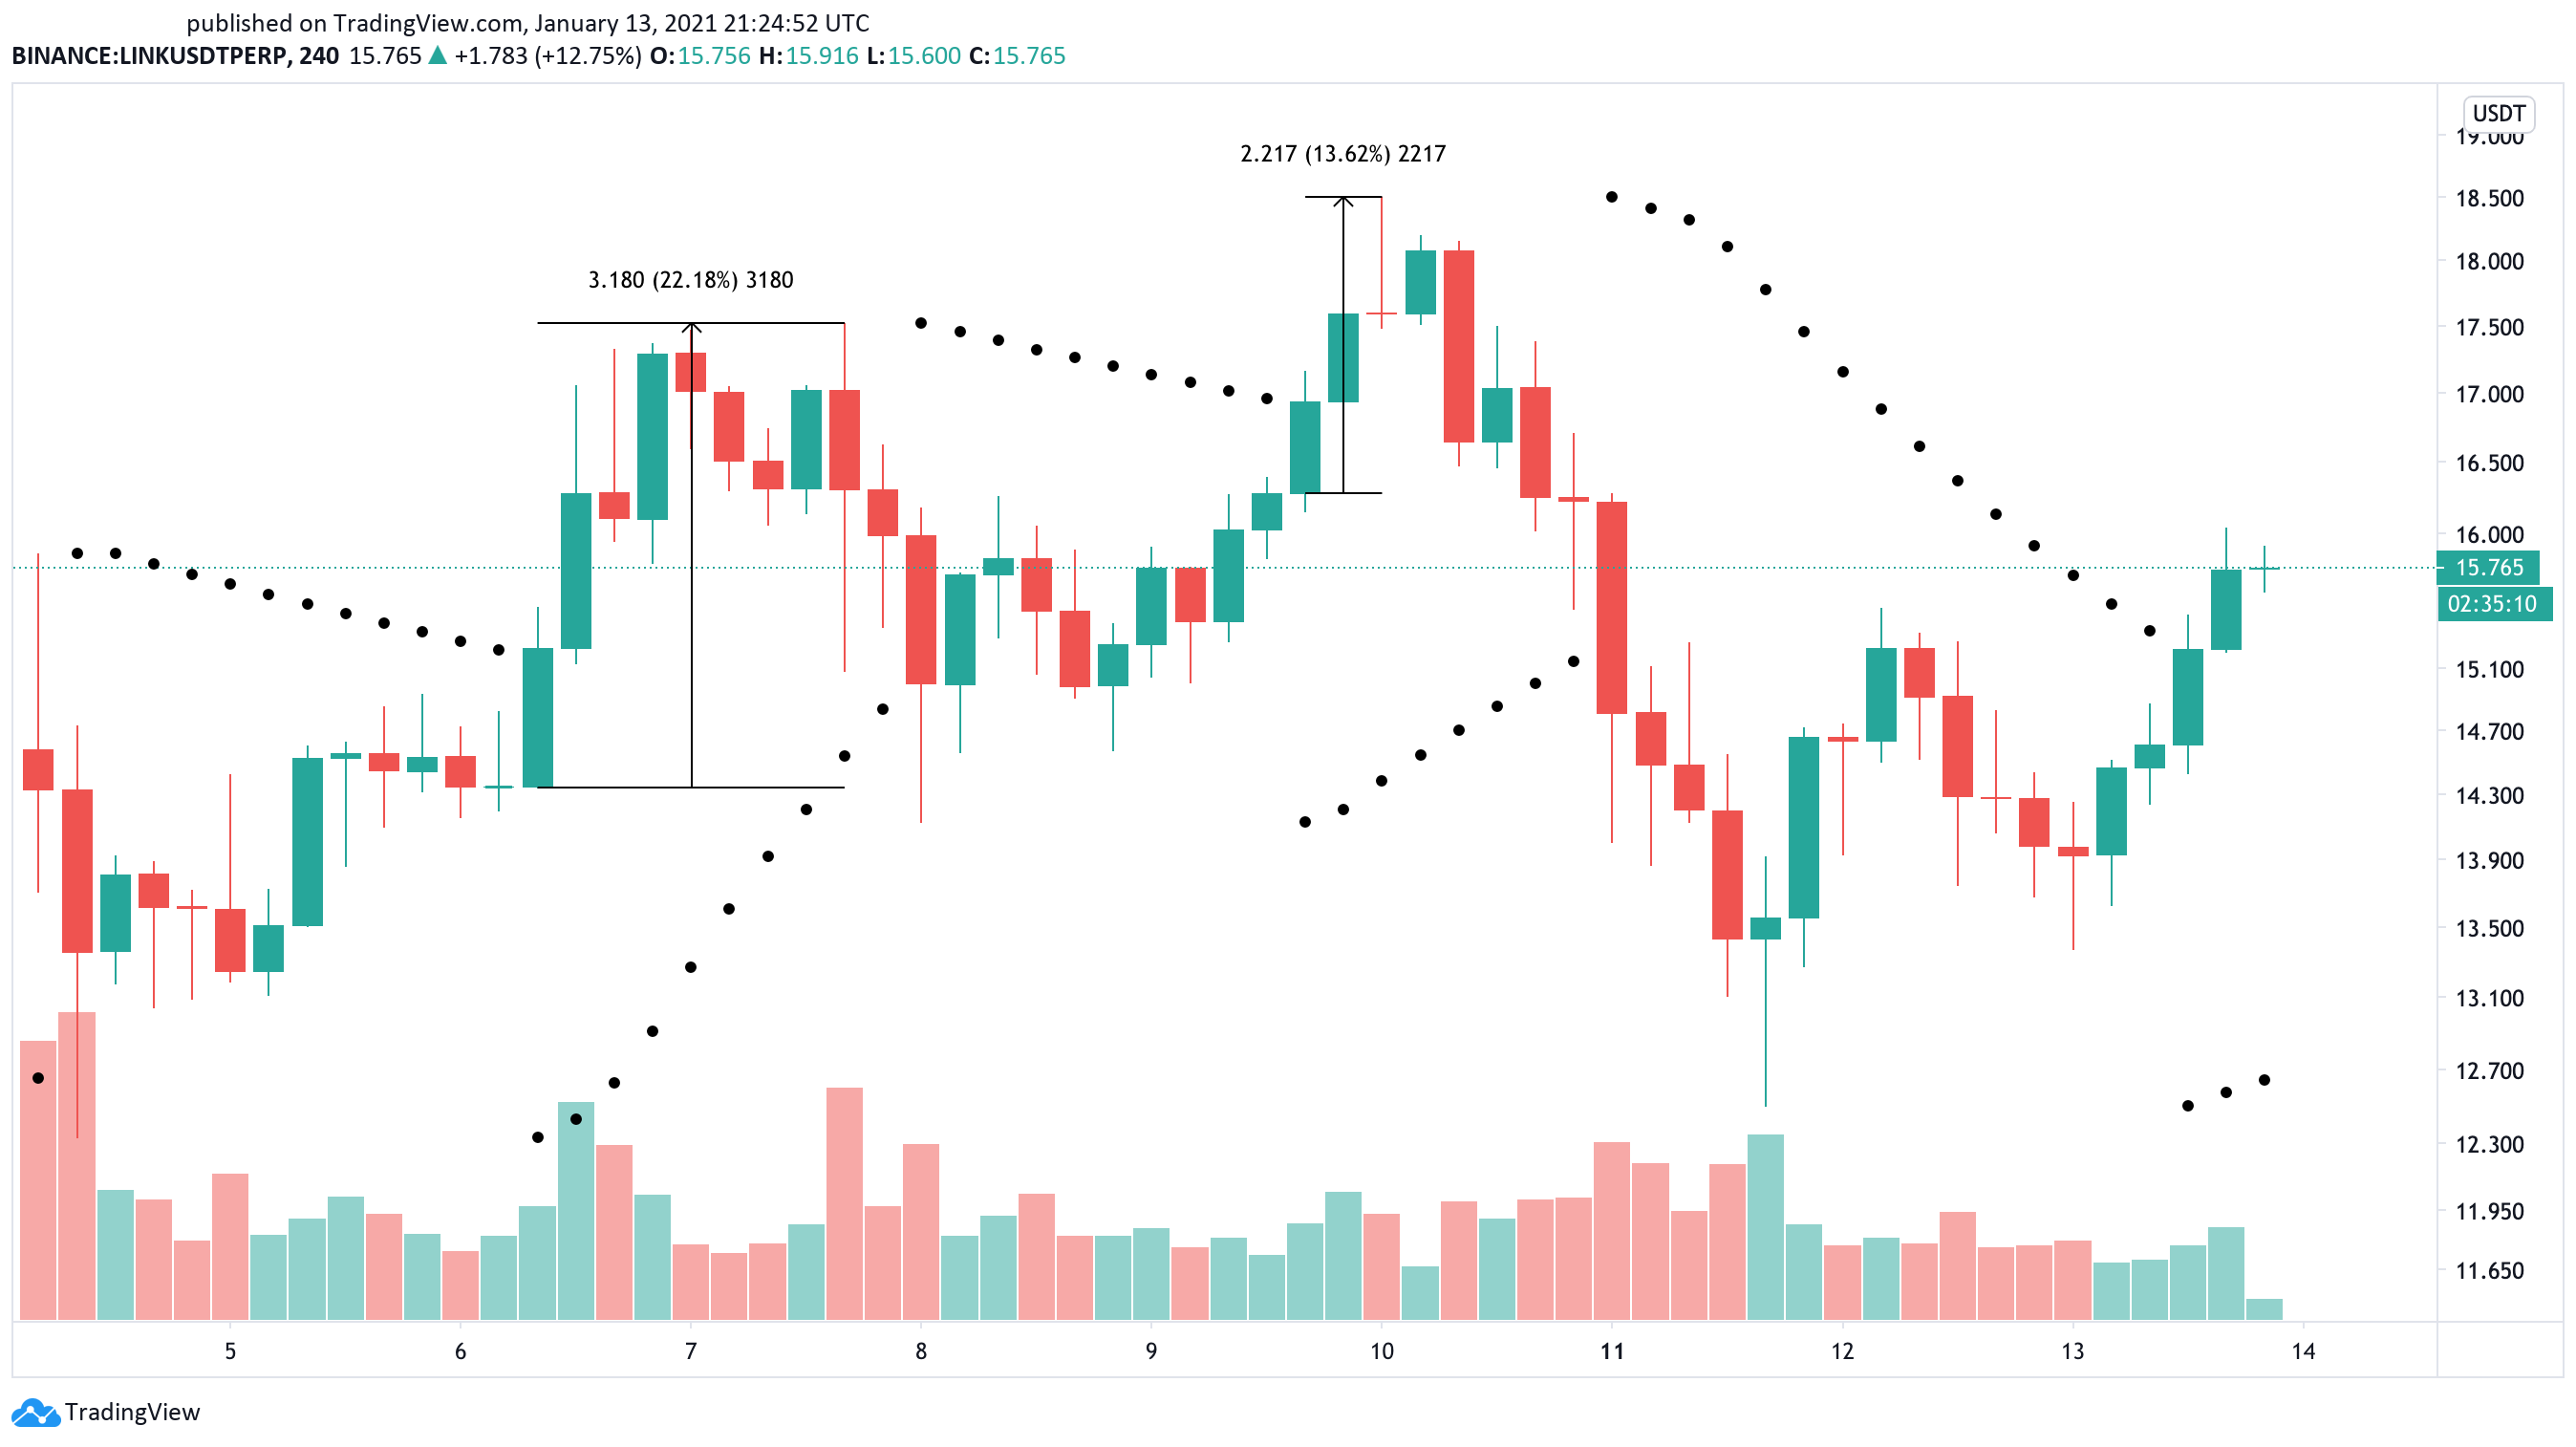
Given the rising price action, the parabolic stop and reverse, or “SAR,” turned bullish.
This trend-following indicator now forecasts that Chainlink’s downtrend reached exhaustion, based on the 4-hour chart.
Each time the stop and reversal points move below an asset’s price, it is considered a positive sign. Therefore, the recent flip over indicates that this token’s trend changed from bearish to bullish.
Historically, the stop and reversal system has been highly effective in determining the course of LINK. The last two times the parabolic SAR flipped from bearish to bullish within the 4-hour chart, Chainlink’s token surged by 22.20% and 13.60%, respectively.
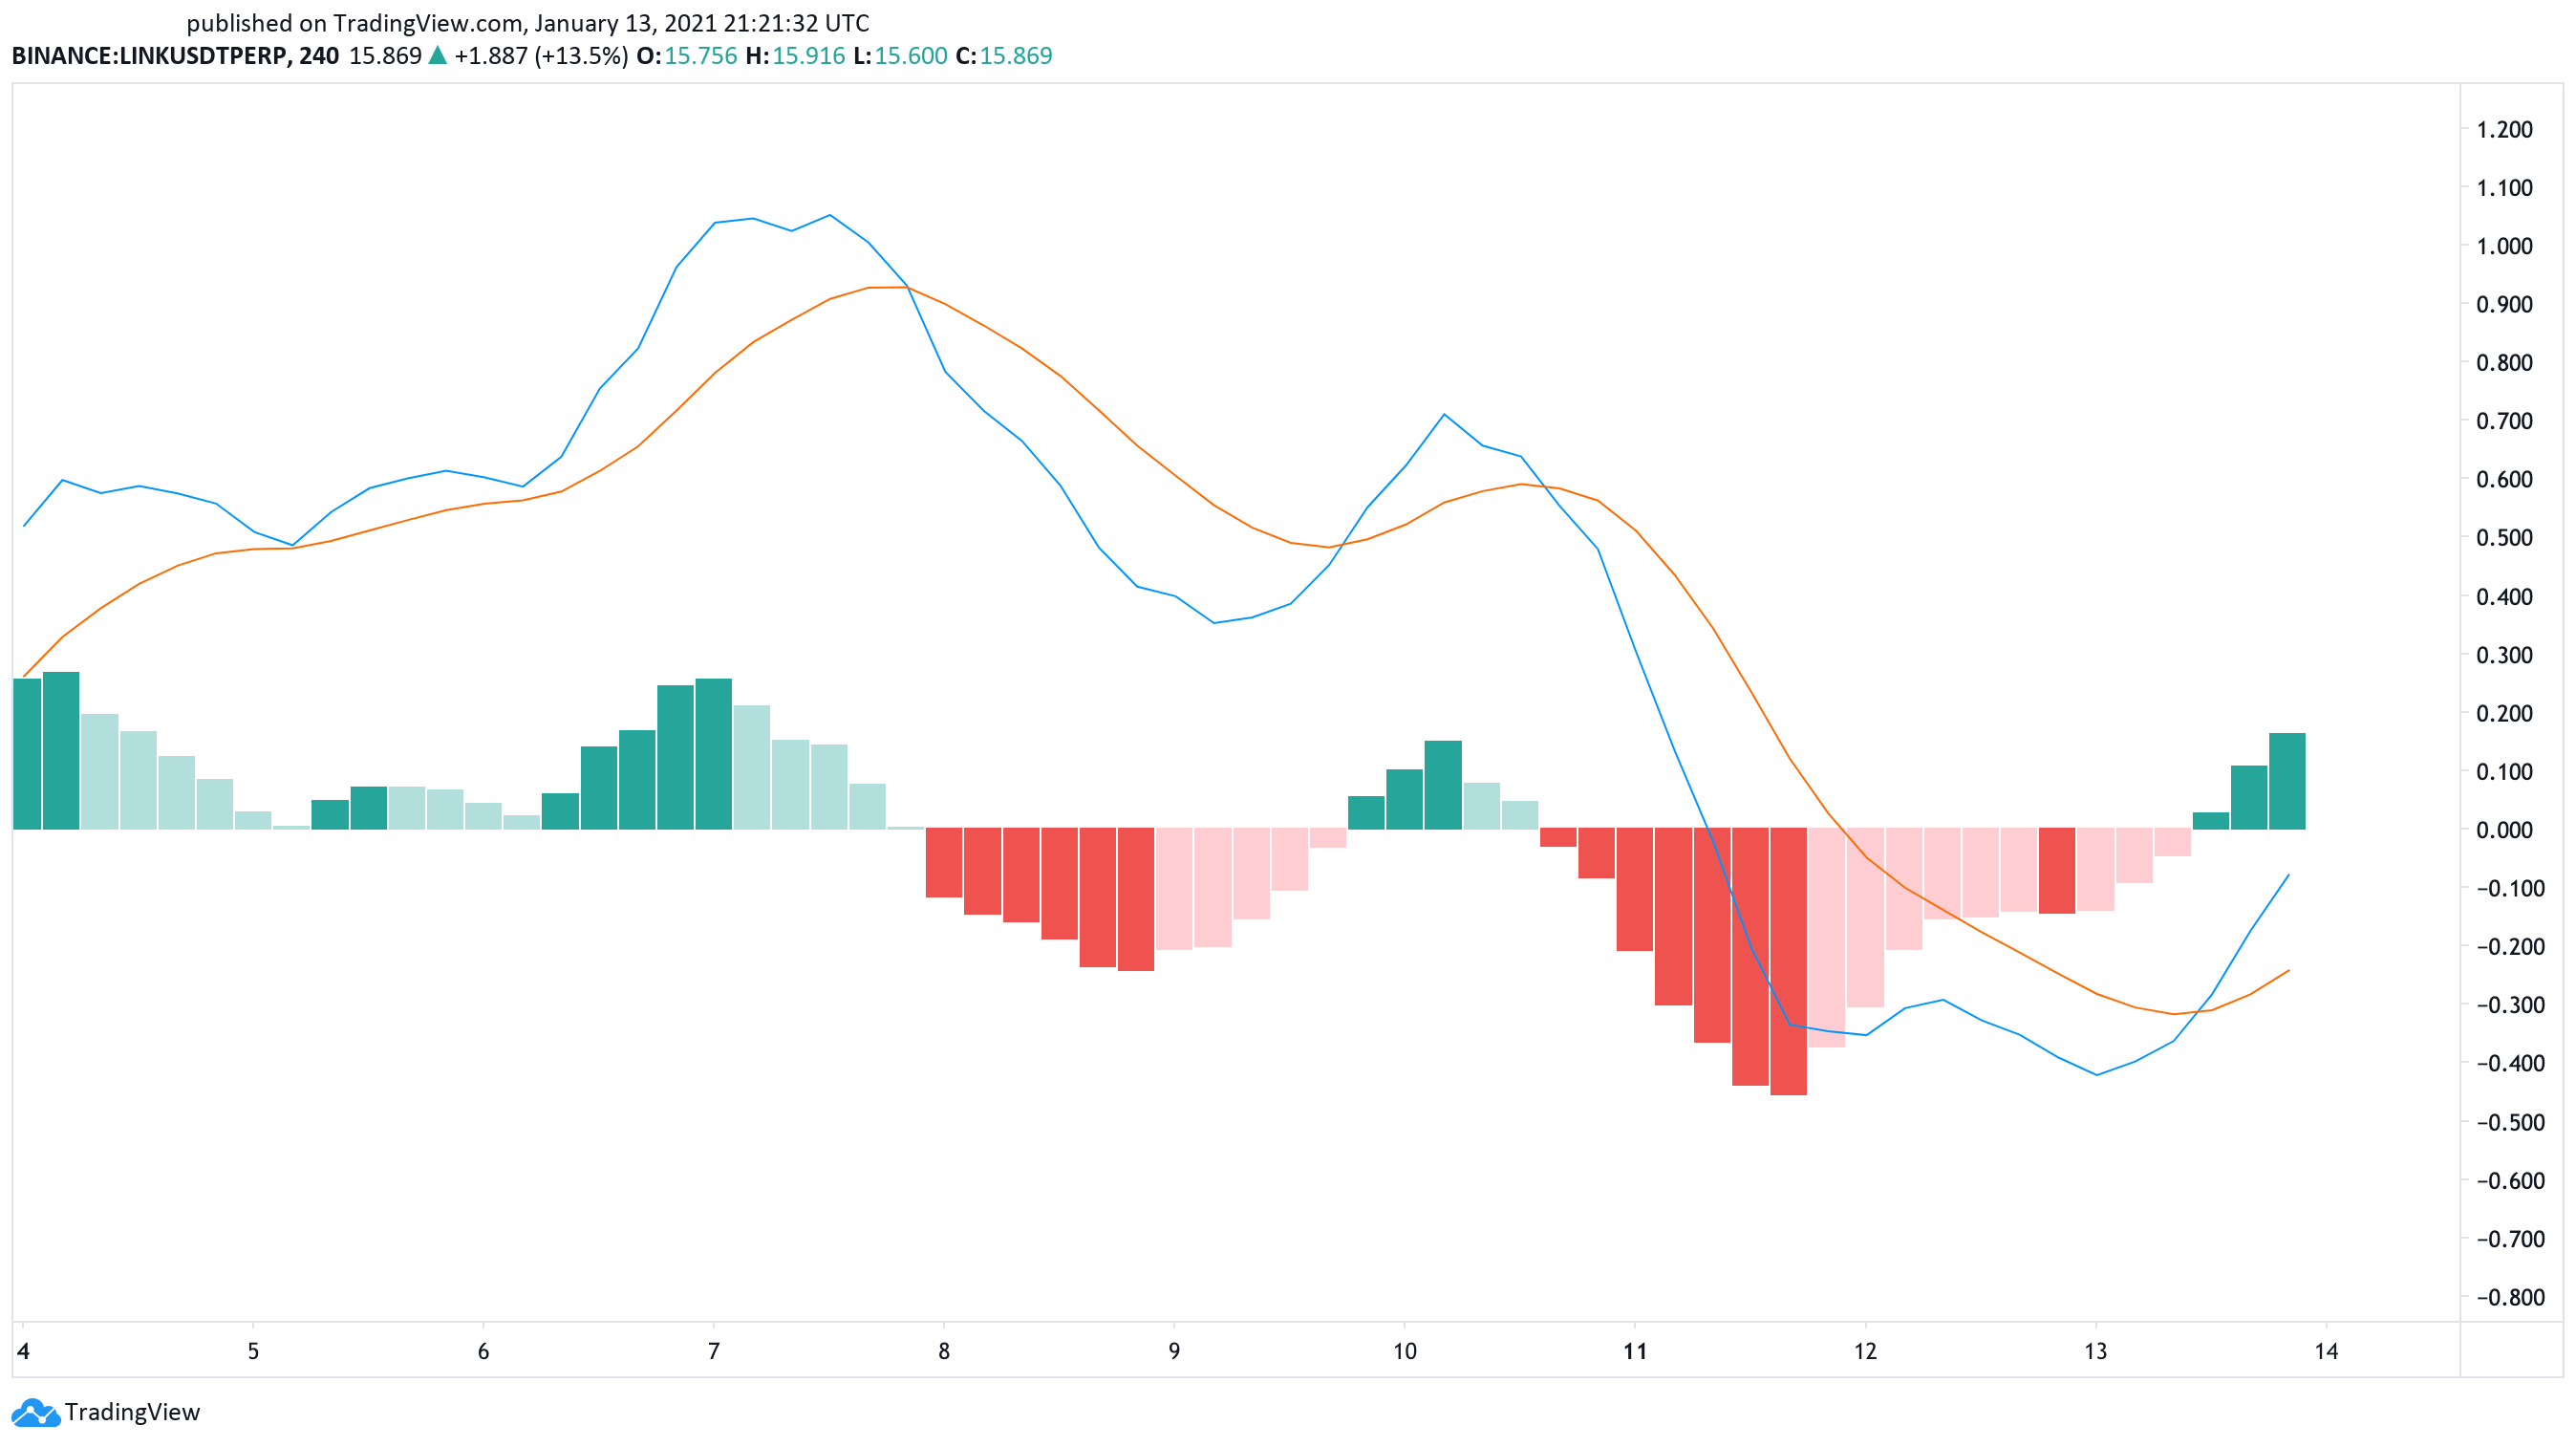
The moving average convergence divergence, or MACD, adds credence to the optimistic outlook.
This technical indicator, which follows the path of a trend and calculates its momentum, had a bullish crossover within the same time frame. As the 12 exponential moving average crossed above the 26 exponential moving average, the odds for further upward price action increased significantly.
If Chainlink continues to hold above the 50 moving average on the 4-hour chart, its price will likely continue to regain lost ground. This altcoin may aim for August 2020’s all-time high of nearly $20 or new record highs on its way up.
Nonetheless, slicing through the underlying support could push LINK’s market value down over 15% to the 200-day moving average, at $13.
Band Protocol Primed for a 60% Upswing
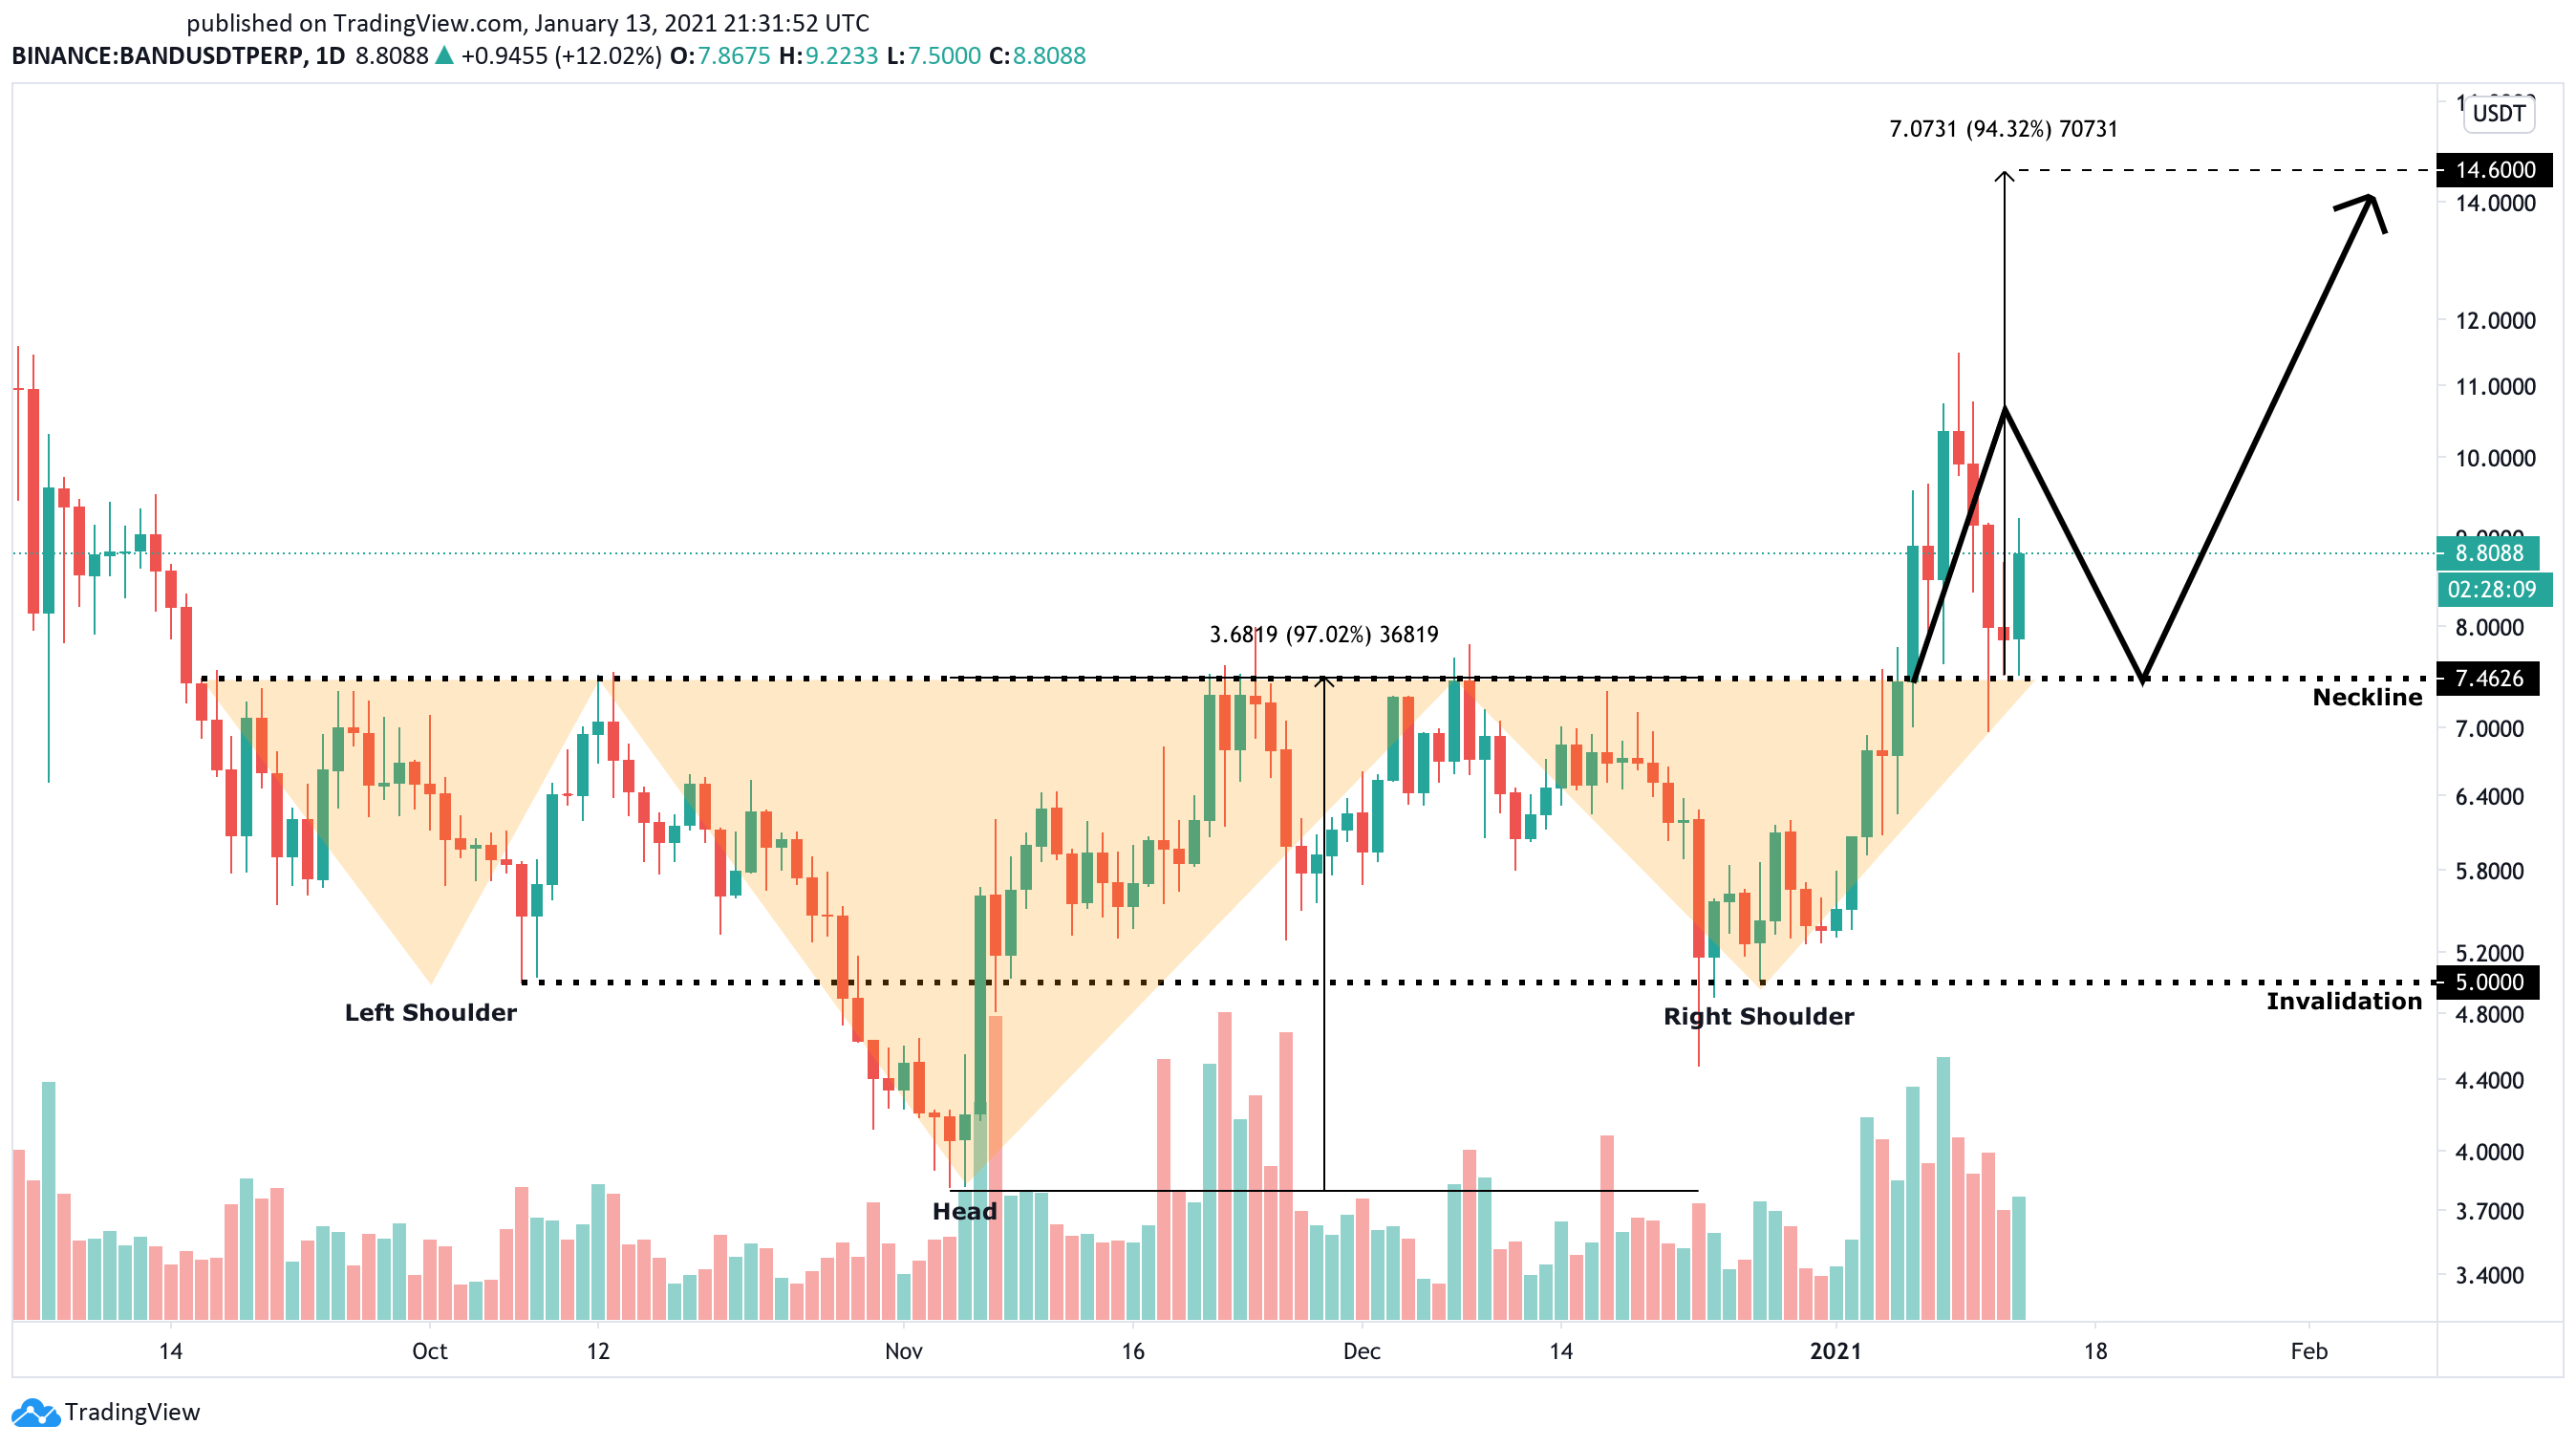
Band Protocol broke out of an inverse head-and-shoulders formation on Jan. 6, which was developing over the past four months within the token’s weekly chart. After slicing through the pattern’s neckline at $7.50, the DeFi token surged by more than 50% to peak at $11.40.
A spike in selling pressure around this price hurdle pushed BAND back to the underlying support, from where it rebounded.
Although the recent correction generated massive losses across the board, it can be considered a positive sign for future price growth. Assets that break out of inverse head-and-shoulders patterns tend to retrace to provide sidelined investors an opportunity to get back into the market.
A new influx of capital usually helps prices rebound to meet the pattern’s target, which in BAND’s case is $14.60. This target is determined by measuring the distance between the head and the neckline of the inverse head-and-shoulders pattern and adding it to the breakout point.
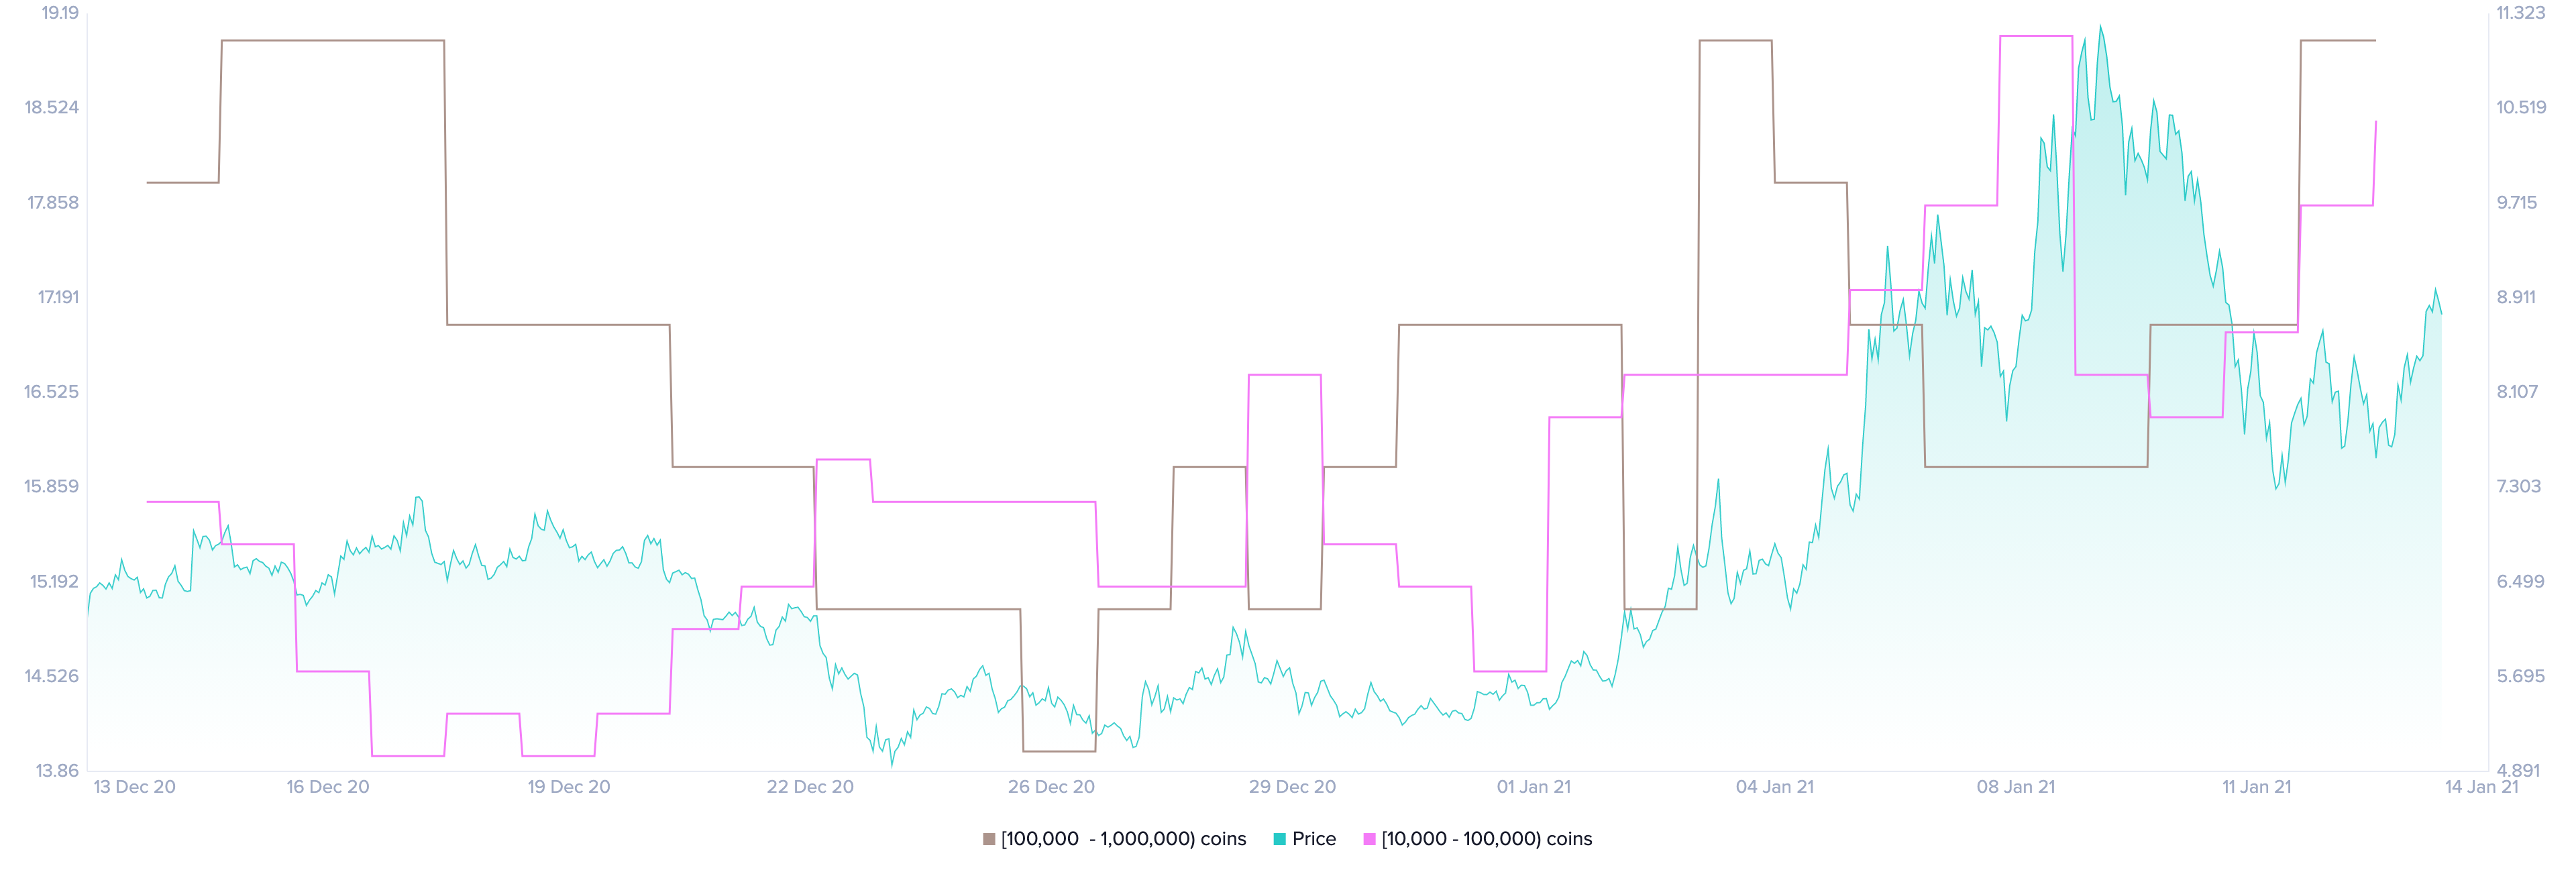
The bullish thesis holds when looking at Santiment’s holder distribution chart. The behavioral analytics firm recorded a significant spike in the number of whales on Band Protocol’s network while prices tumbled.
Indeed, the number of addresses holding 10,000 to 1,000,000 BAND shot up. Roughly nine whales have joined the network, representing a 14.80% increase in such a short period.
At first glance, the increasing demand among large investors may seem insignificant. However, when considering that these whales hold between $90,000 and $9 million in BAND, the sudden spike in buying pressure can translate into millions of dollars.
If the buying spree continues, Band Protocol may have the ability to advance further and meet the inverse head-and-shoulders’ target of $14.60.
It is worth noting that the first sign of invitation to Band Protocol’s bullish outlook will come if its price closes below the neckline at $7.50.
By breaking below this support level, BAND may force investors to panic sell their holdings. If this were to happen, this cryptocurrency could revisit the $5.00 mark.
The Cryptocurrency Market Moves Forward
Most digital assets in the cryptocurrency market look unstoppable now that a new bull cycle has begun.
Although some market participants seem concerned about the lack of any significant correction, the market crash on Jan. 10 may have been the opportunity that sidelined investors had been waiting for.
The way large investors flocked to exchanges to “buy the dip” suggests that the market is bound for another leg up.
Most recently, CryptoQuant recorded a significant spike in stablecoin transfers to exchanges. Such behavior has helped fuel previous rebounds, pushing prices higher.
If history were to repeat itself, Chainlink could rise to $20.00 and Band Protocol towards $15.00.
Disclosure: At the time of press, the author held Ethereum and Bitcoin.