 Earn with Nexo

Pundi X Price Analysis NPXS / USD: Bulls On Holiday
After the recent breakout, the pair has cooled down significantly.
- Pundi X has a bullish short-term outlook, with the NPXS / USD pair still holding above key neckline support
- PundiX still remains technically bullish over the medium-term time frame
- The daily time frame is showing that the inverted head and shoulders has now reached its full upside projection
Pundi X / USD Short-term price analysis
Pundi X has a bullish short-term outlook, with the cryptocurrency still holding above major technical support on the four-hour time frame.
The four-hour time frame shows that the NPXS / USD pair is starting to correct lower after the cryptocurrency reached its bullish invalidation target.
Technical indicators across the four-hour time frame are turning lower as the NPXS / USD pair undergoes a technical correction.
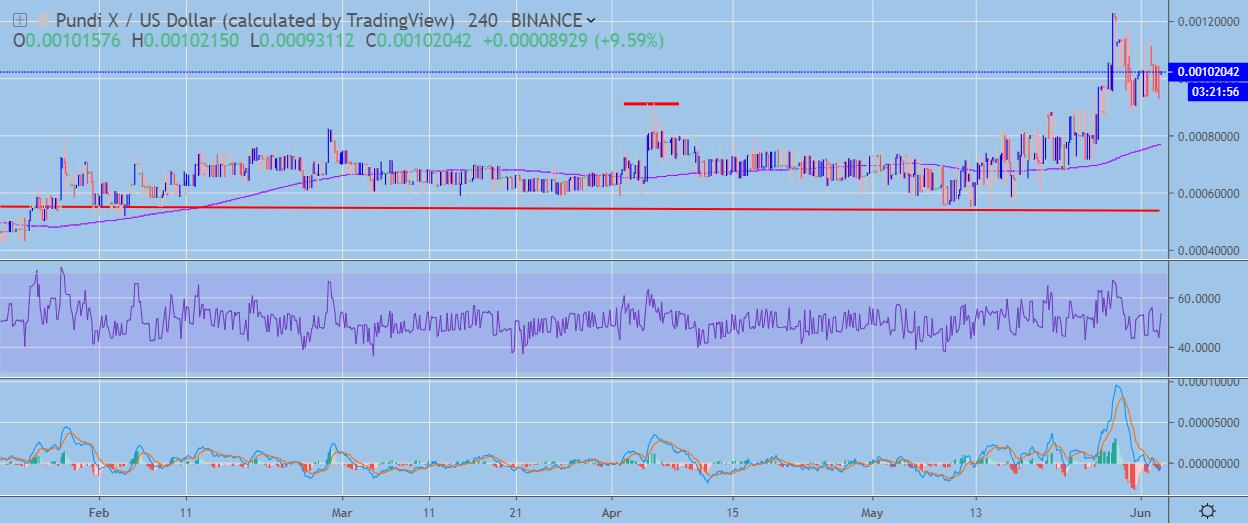 NPXS / USD H4 Chart by TradingView
Pattern Watch
Traders note that the head of the invalidated head and shoulders pattern now offers major technical support on the four-hour time frame.
Relative Strength Index
The RSI indicator is neutral on the four-hour time frame, although downside pressures are building.
MACD Indicator
The MACD indicator has turned bearish on the four-hour time frame, with the MACD signal line and histogram both generating a sell signal.
Pundi X / USD Medium-term price analysis
Pundi X has a bullish medium-term bias, with the cryptocurrency advancing to its highest trading level since November 19th, 2018.
The daily time frame is showing that the large inverted head and shoulders pattern has reached its full upside projection, with the NPXS / USD pair retracing back towards neckline support.
Technical indicators on the daily time frame remains bullish despite the recent technical correction.
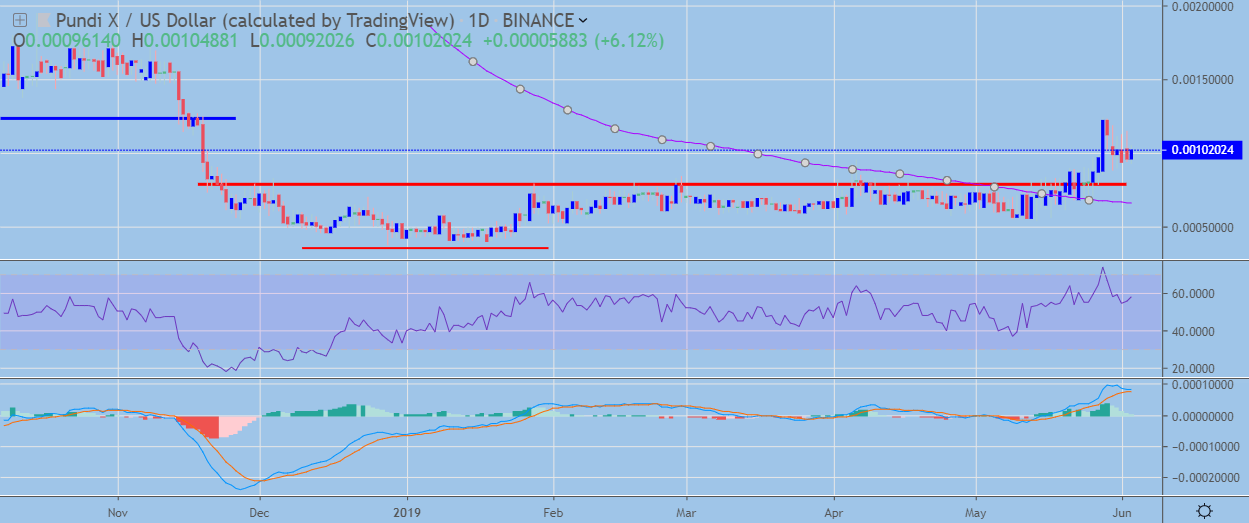 NPXS / USD Daily Chart by TradingView
Pattern Watch
Traders should note that a bearish head and shoulders could start to form on the daily time frame if the technical correction gathers pace.
Relative Strength Index
The RSI indicator remains bullish on the daily time frame and still shows scope to trade higher.
MACD Indicator
The MACD indicator remains bullish on the daily time frame, although it is starting to appear in-tents-ly overstretched.
Conclusion
PundiX has undergone a strong technical correction after performing a bullish breakout across both time frames and rallying to its highest trading level since November 19th, 2018.
Bulls now need to keep the recent upside pressure in place by moving the cryptocurrency to a fresh 2019 trading high. A bearish pattern could start to form on the daily time frame if buyers fail to rally the NPXS / USD pair.
Pundi X is a project seeking to make crypto payments simpler.