
Pundi X Price Analysis NPXS / USD: Last Minute Save
Encouraging signs are appearing, but the outlook is still negative.
- Pundi X has a bearish short-term outlook, with the NPXS / USD pair still trapped below key technical support
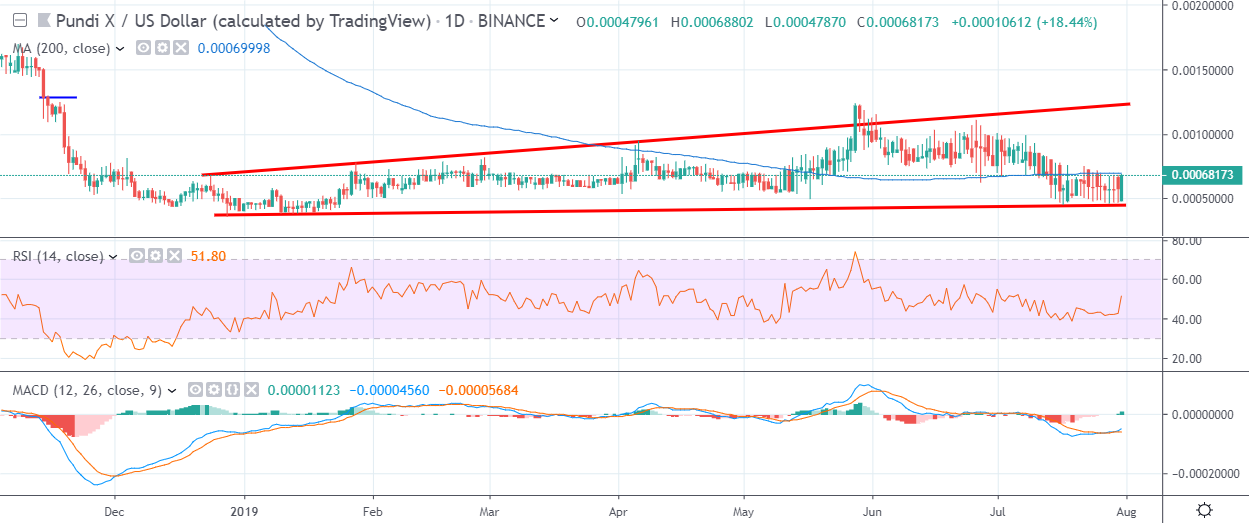
- NPXS / USD bulls are now testing towards the pair’s 200-day moving average
- The daily time frame highlights an ascending broadening wedge pattern
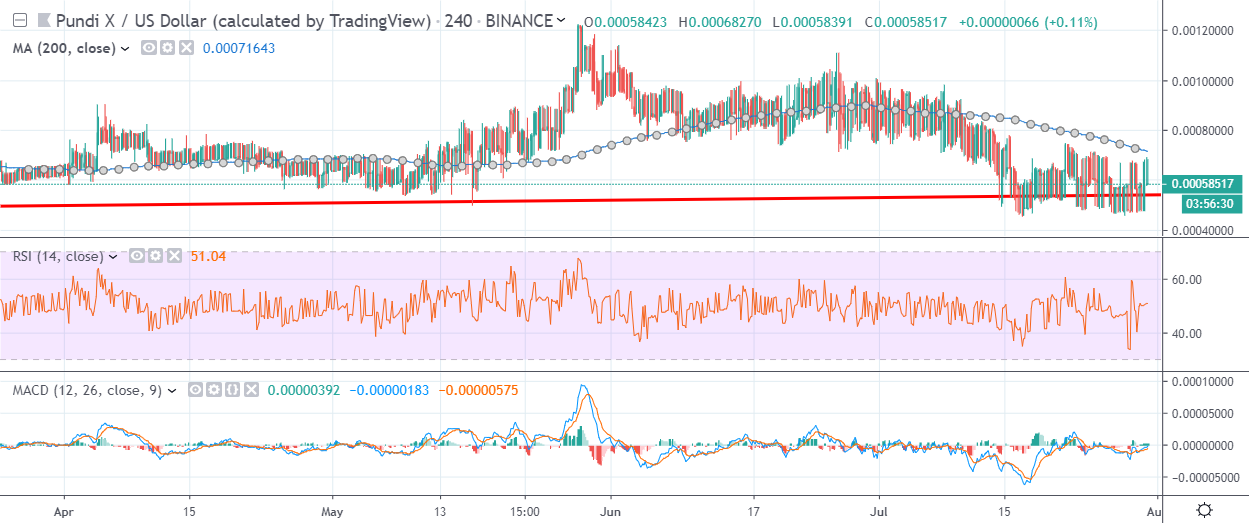
Pundi X / USD Short-term price analysis
Pundi X has a bearish short-term outlook, with the cryptocurrency still trading below major technical support on the four-hour time frame.
The four-hour time frame shows that the NPXS / USD pair continues to consolidate around the neckline of a bearish head and shoulders pattern.
Technical indicators across the four-hour time frame are neutral and currently failing to provide a clear trading signal.
Pattern Watch
Traders note that the NPXS / USD pair could test towards its all-time trading low if the bearish head and shoulders pattern is triggered on the four-hour time frame.
Relative Strength Index
The RSI indicator is neutral on the four-hour time frame and currently shows no clear trading bias.
MACD Indicator
The MACD indicator is neutral on four-hour time frame, with the MACD signal line and histogram failing to offer a clear trading signal.
Pundi X / USD Medium-term price analysis
Pundi X has a neutral medium-term trading bias, with the cryptocurrency testing towards its key 200-day moving average.
The daily time frame is showing that the NPXS / USD pair is trapped within an ascending broadening wedge pattern, with sellers repeatedly failing to break below key trendline support.
Technical indicators are also neutral on the daily time frame and failing to provide a clear trading signal.
Pattern Watch
Traders should note that ascending broadening wedge patterns are typically accompanied by bearish breakouts.
Relative Strength Index
The RSI indicator is rising on the daily time frame, although it has yet to turn technically bullish.
MACD Indicator
The MACD indicator is neutral on the daily time frame and is failing to provide a clear trading signal.
Conclusion
Despite an encouraging move back towards the cryptocurrency’s 200-day moving average, PundiX still remains in the danger zone technically, as the presence of bearish patterns across both time horizons continues to suggest that the NPXS / USD pair is vulnerable to further losses.
Pundi X is a project seeking to make crypto payments simpler.