
Ripple Price Analysis XRP / USD: Holding Comfortably
It's steady above its moving averages, but needs some extra oomph.
- Ripple has a bullish short-term trading bias, with the cryptocurrency moving towards the best levels of 2019
- The XRP / USD pair continues to hold firm above its key 200-day moving average
- The daily time frame continues to highlight the 0.6000 level as a possible bullish target
Ripple / USD Short-term price analysis
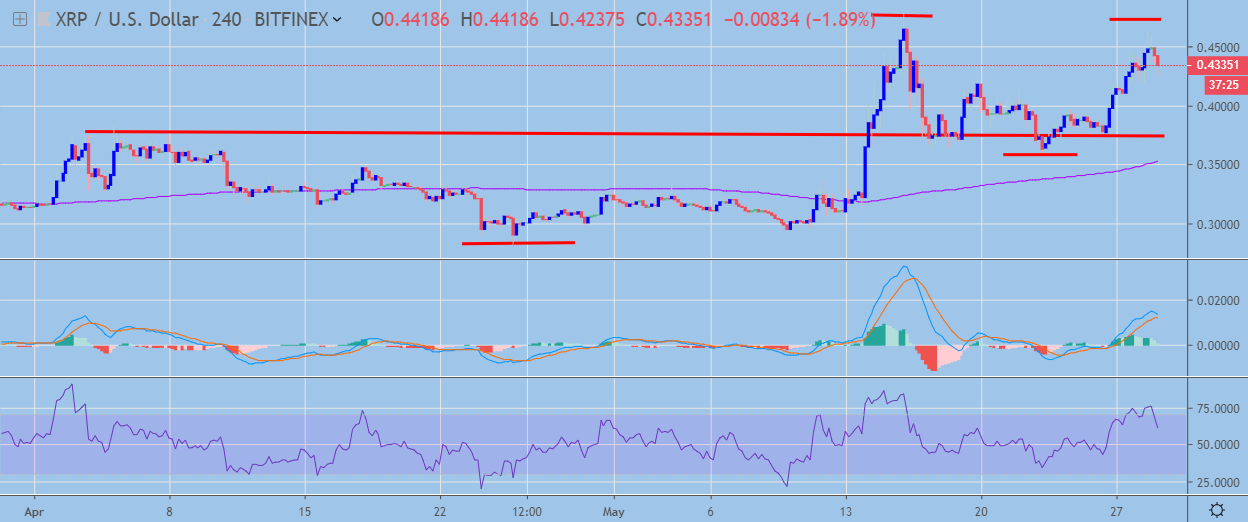
Ripple has a bullish short-term trading outlook, with the XRP / USD pair still holding firm towards the best levels of 2019.
The four-hour time frame shows that the large inverted head and shoulders pattern has reached its upside target, while another smaller inverted head and shoulders pattern may be forming.
Technical indicators across the four-hour time frame are still bullish, although they are attempting to turn lower.
 XRP / USD H4 Chart by TradingView
Pattern Watch
Traders should be on guard in case a bearish double-top pattern starts to form across the four-hour time frame.
Relative Strength Index
The RSI indicator is bullish on the four-hour time frame, although it is starting to correct from overbought territory.
MACD Indicator
The MACD indicator is bullish on the four-hour time frame, although downward pressure is building on the indicator.
Ripple / USD Medium-term price analysis
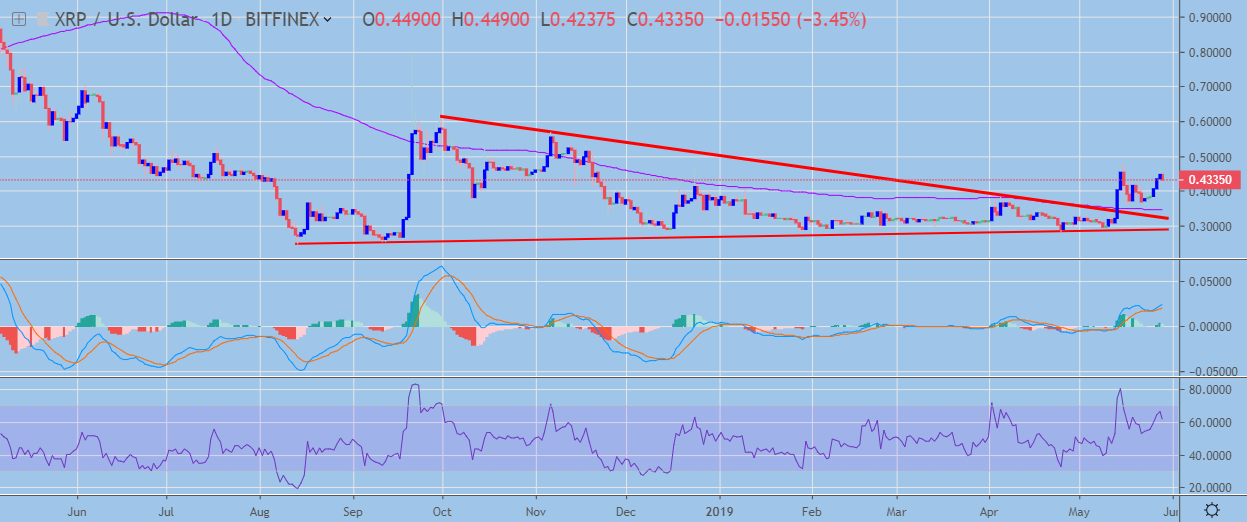
Ripple has a bullish medium-term trading outlook, with the XRP / USD pair still maintaining price above its trend defining 200-day moving average.
The daily time frame shows that the recent bullish breakout from the descending triangle pattern still remains valid and has yet to reach its full upside projection.
Indicators on the daily time frame have a slight bullish bias and can still trade higher.
 XRP / USD Daily Chart by TradingView
Pattern Watch
Traders should note that the overall bullish target of the descending triangle pattern on the daily time frame is located around the 0.6000 level.
Relative Strength Index
The Relative Strength indicator on the daily time frame is still bullish, although it is coming under increasing downward pressure.
MACD Indicator
The MACD indicator on the daily time frame remains bullish and can still continue to move higher.
Conclusion
Ripple continues to hold onto recent upside gains as the popular cryptocurrency appears increasingly comfortable above its 200-day moving average.
While the daily time frame highlights the 0.6000 level as an upside target, the four-hour time frame shows that short-term bulls need to exceed the current monthly trading high to maintain upside pressure.
XRP, Ripple, are they the same or there’s a difference? Find out in our coin guide.
A deeper look into the merits of the project can be found in our DARE.