
Ripple-Promoted Token Price Analysis XRP / USD: Ripped Apart
XRP has lost over 30% of its value.
- The Ripple-associated token suffers its largest one-day drop since late June this year
- The XRP / USD pair has broken below its current 2019 trading low
- Weakness under the $0.2380 level could provoke an upcoming test of the $0.2000 level
The cryptocurrency associated with Ripple has come under tremendous downside pressure alongside the broader cryptocurrency market, with the third-largest cryptocurrency by market capitalization declining to a fresh 2019 trading low. The XRP / USD pair also suffered its largest one-day decline since late-June this year.
After performing a promising technical breakout above the $0.3000 level last week, the latest bearish decline has put the cryptocurrency on shaky ground once again. In terms of losses, the XRP / USD pair has lost over thirty percent in value since peaking around the $0.3200 level last week.
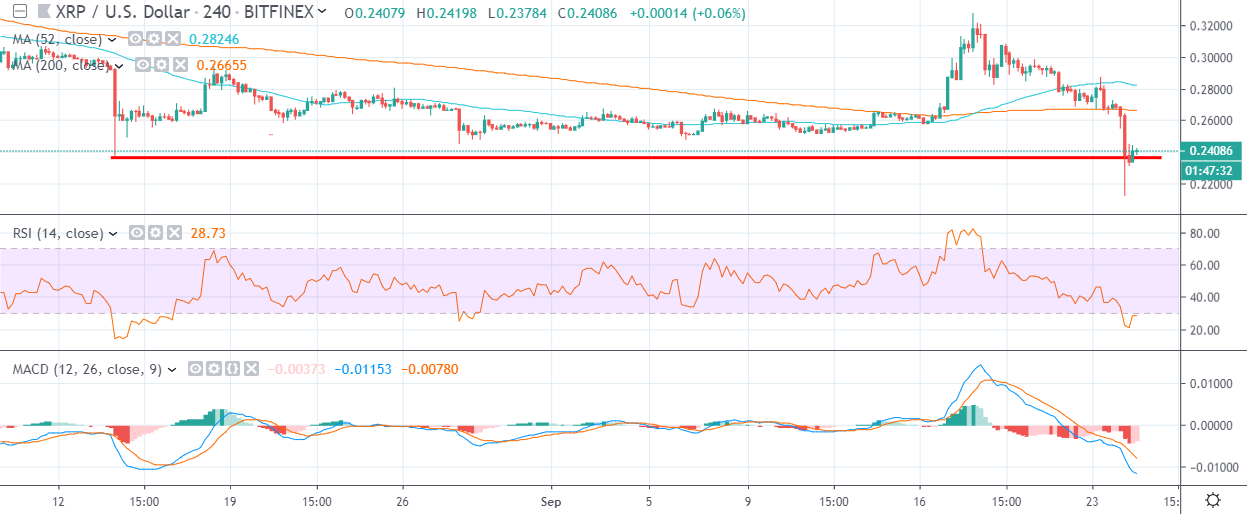
The XRP / USD pair started the new trading week under pressure, as it soon became clear the cryptocurrency was struggling to regain the bullish momentum of last week. The decline in the cryptocurrency has so far extended towards the $0.2150 region, with the XRP / USD pair recovering somewhat higher towards the $0.2400 resistance level at the time of writing.
Worryingly for the XRP / USD pair, the total market capitalization of the cryptocurrency market is now in bear mode, after it slipped below its 200-day moving average. It’s crashing below the $230,000,000,000 level in rapid fashion.
From a technical perspective it is imperative that the XRP / USD pair regains the $0.2650 level over the coming sessions. This key technical area was instrumental in last weeks’ bullish recovery and is now a key technical region that XRP / USD bulls must immediately reclaim.
The downside for the XRP / USD pair could be brutal if the cryptocurrency continues fall. With this in mind, bearish targets to the downside could eventually extend towards the $0.2000 and $0.1850 levels if a recovery is not forthcoming.
According to the latest sentiment data from TheTIE.io, the short-term sentiment towards the Ripple-promoted token is neutral, at 46.00 %, while the overall long-term sentiment towards the cryptocurrency is more bearish, at 36.00%.
Upside Potential
The four-hour time frame highlights the 50-period and 200-period moving averages as the key upcoming resistance area bulls need to reclaim. At present these key moving averages are located at the $0.2650 and $0.2850 areas.
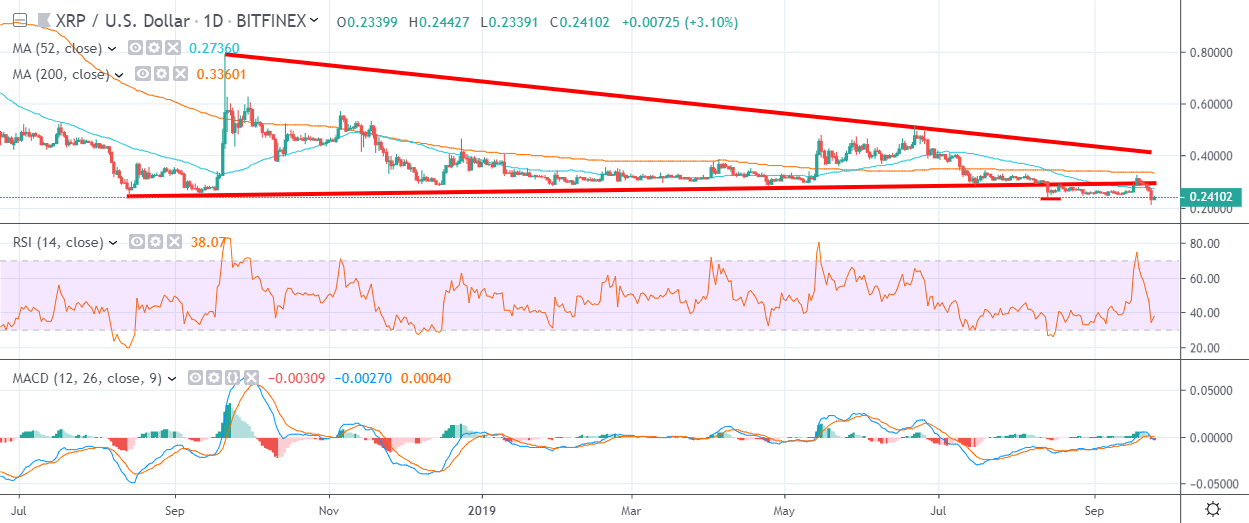
The daily time frame highlights the 50-day moving average as a key technical area above which bulls need to gain strength to encourage additional buying interest. It is currently found at the $0.2730 level. A daily close above this area would certainly be encouraging for bulls.
Downside Potential
The four-hour time frame is showing that a potential head and shoulders pattern may be forming, with the $0.2380 level the neckline of the bearish pattern.
The daily time frame is currently showing limited technical support below the $0.2150 level, with $0.2000 and $0.1850 levels the strongest forms of support below.
Summary
Ripple’s token has seen an extremely bearish reversal from its current monthly trading high, with the cryptocurrency shedding over thirty percent in value from peak-to-trough.
If bulls fail to stage a significant rally above the $0.2380 level, the XRP / USD pair could easily tumble to a new 2019 trading low, with the $0.2000 level the likely near-term bearish target.
Find out more about Ripple in our coin guide.
A deeper look into the merits of the project can be found in our DARE.