
Ripple-Promoted Token Price Analysis XRP / USD: Great Revival
XRP has staged a double-digit recovery.
- Ripple’s token has posted double-digit gains following a major rally in the altcoin space
- The XRP / USD pair could start to move towards the $0.3500 level in the short-term
- Technical pullbacks under the $0.3000 level should find strong buying interest from the $0.2850 level
XRP has finally made an upside recovery after spending close to five weeks trading under the psychological $0.3000 level. A broad-based rally in the altcoin space inspired the XRP / USD pair to move to its highest trading level since August 8th this year.
The XRP / USD has so far found technical resistance from just before the $0.3150 level, with the cryptocurrency recording impressive double-digit gains. In fact, from the August trading low, the Ripple-favored token has now recovered over thirty percent higher.
The cryptocurrency has recently been on shaky ground around the $0.2600 level, with the XRP / USD pair showing few signs that buyers were returning. The latest recovery in the XRP / USD pair could be a game changer for the cryptocurrency in the medium-term, particularly if buyers can steady price above the psychological $0.3000 level.
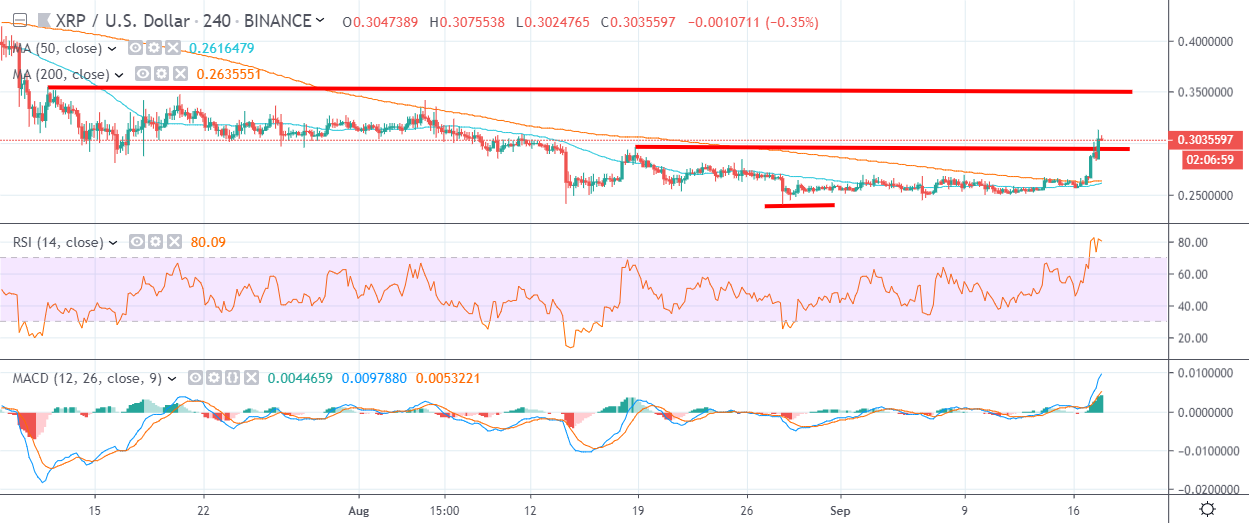
The technicals for the XRP / USD pair are showing various scenarios that may play-out in the short-term. A bullish pattern is starting to take shape across the lower time frame, which could eventually form into a large inverted head and shoulders pattern if buyers can force price towards the $0.3500 level.
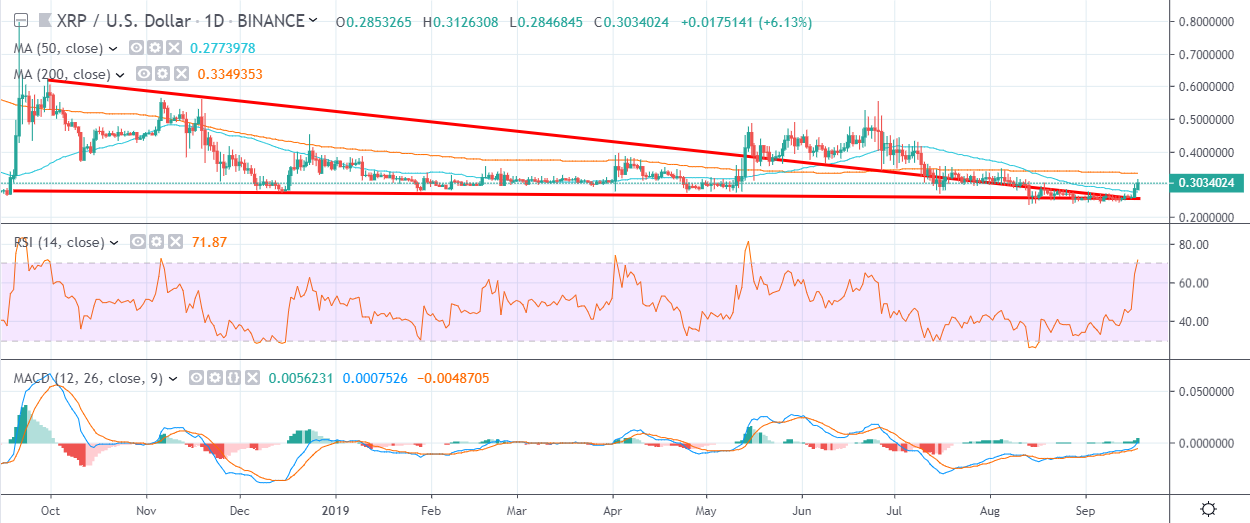
The bullish pattern has a $0.1200 upside projection, which could eventually propel the XRP / USD pair towards the $0.4700 level. The daily time frame also shows that a descending triangle pattern breakout is currently underway.
Looking at the near-term downside, moves below the $0.3000 level can expect to find strong dip-buying demand from around the $0.2850 level. Any sustained moves below the $0.2770 level should be troubling for XRP / USD bulls.
According to the latest sentiment data from TheTIE.io, the short-term sentiment towards Ripple is overwhelmingly bullish 89.00 %, while the overall long-term sentiment towards the cryptocurrency is bearish, at 35.00%.
Upside Potential
The four-hour time frame is showing that XRP / USD pair has moved above its key short-term moving averages, which further highlights that bulls are back in charge in the near-term.
The daily time frame highlights that the XRP / USD pair’s 200-day moving average as the likely upside target, around the $0.3500 level. The $0.3500 level also corresponds with the neckline of the previously mentioned inverted head and shoulders pattern.
Downside Potential
The four-hour time frame is showing that the recent rally in the XRP / USD pair has created pockets of untested demand, around the $0.2850 and $0.2780 levels. Price may eventually lower to test these areas once indicators become oversold.
The daily time frame is currently showing major trendline support around the $0.2650 level, while the XRP / USD pair’s 50-day moving average is located around the $0.2850 level.
Summary
The Ripple-promoted token has staged an impressive double-digit rally after spending weeks trading towards the worst levels of 2019.
Technical analysis shows the $0.3500 and $0.4700 levels as the likely upside targets if bulls can maintain the recent upside pressure.
Find out more about Ripple in our coin guide.
A deeper look into the merits of the project can be found in our DARE.