Ripple-Promoted Token Price Analysis XRP / USD: Worst Nightmare
XRP is trading at its weakest level since December 2017.

Share this article
- Ripple’s token has a bearish short-term trading bias, with the XRP / USD pair trading at its weakest level since December 2017
- The bearish head and shoulders pattern on the four-hour time frame has now reached its full downside projection
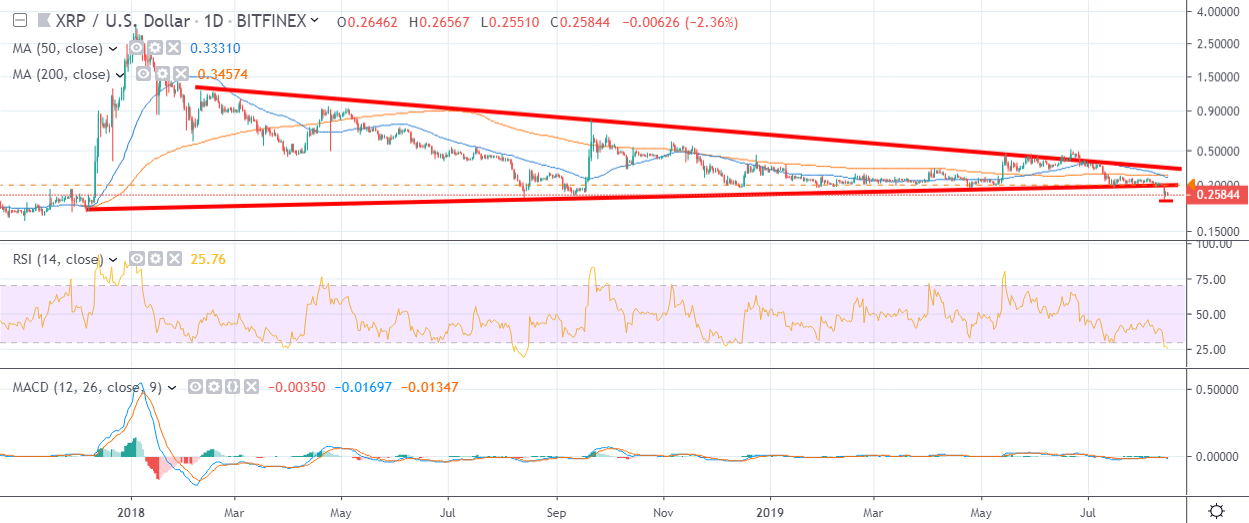
- The daily time frame shows that a bearish breakout has occurred below a large wedge pattern
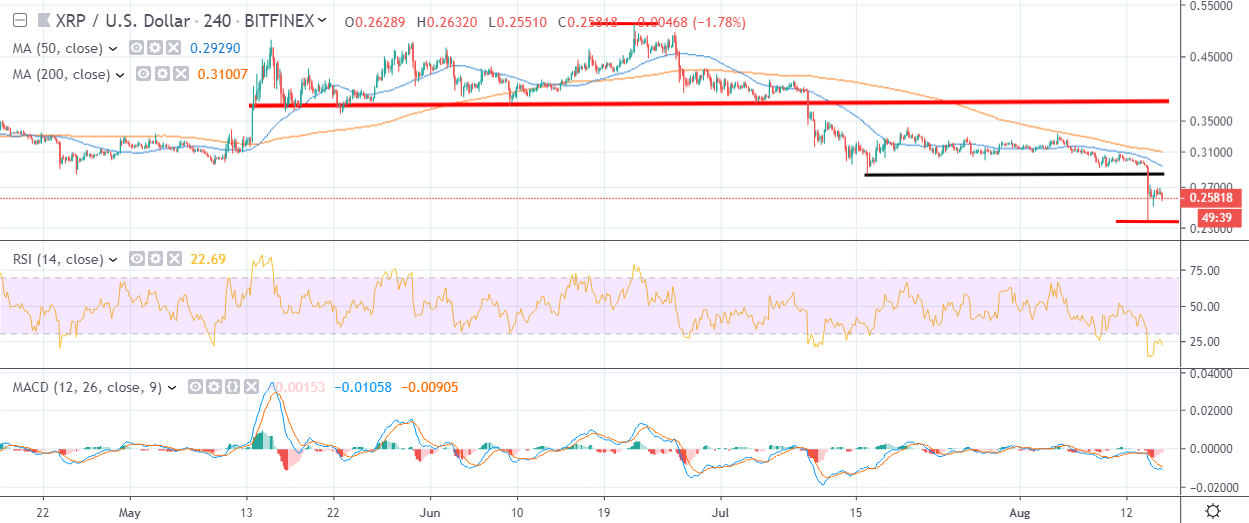
XRP / USD Short-term price analysis
Ripple’s token has a bearish short-term trading outlook, with the XRP / USD pair tumbling to its weakest level since December 2017.
The four-hour time frame shows that the bearish head and shoulders pattern has now reached its full-downside projection, which may signal an upcoming technical correction.
Major short-term resistance is located at the $0.2860 and $0.3000 levels.
Technical indicators across the four-hour time frame are still bearish and extremely oversold.
Pattern Watch
Traders should note that the XRP / USD pair is extremely bearish while trading under the wedge pattern on the daily time frame.
Relative Strength Index
The RSI indicator remains bearish on the four-hour time frame, although it is now extremely oversold.
MACD Indicator
The MACD indicator remains bearish on the four-hour time frame and continues to generate a sell signal.
XRP / USD Medium-term price analysis
Ripple has a bearish medium-term outlook, with the XRP / USD pair performing a major technical breakout on the daily time frame.
The daily time frame is showing that the XRP / USD pair has fallen below a massive wedge pattern, which provoked a sharp decline towards the 0.2380 level.
Key technical support on the daily time frame is located at the $0.2380 and $0.2000 levels.
Technical indicators on the daily time frame continue to issue strong sell signals.
Pattern Watch
Traders should note that a bearish death cross is also underway on the daily time frame.
Relative Strength Index
The Relative Strength Index on the daily time frame is bearish, although it is approaching oversold territory.
MACD Indicator
The MACD indicator on the daily time frame is bearish and continues to issue a sell signal.
Conclusion
Ripple’s token has come under heavy selling pressure after falling below long-term technical support and triggering a worst-case scenario for the cryptocurrency.
Traders should be on guard for a potential technical bounce if bulls can defend the XRP / USD pair’s multi-year trading low, around the $0.2380 level.
Find out more about Ripple in our coin guide.
A deeper look into the merits of the project can be found in our DARE.
Share this article
