Ripple / USD Technical Analysis: Grasping For Support

Share this article
- Ripple has a bearish short-term trading bias, with the cryptocurrency now trading well below its 200-period moving average on the four-hour time frame
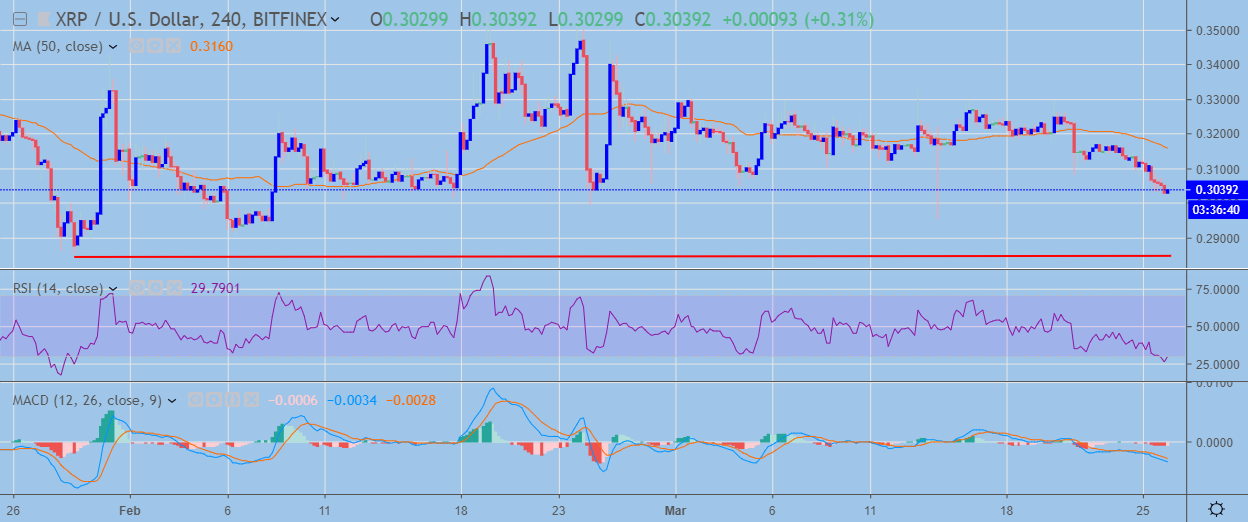
- The four-hour time frame shows a large head and shoulders pattern starting to form
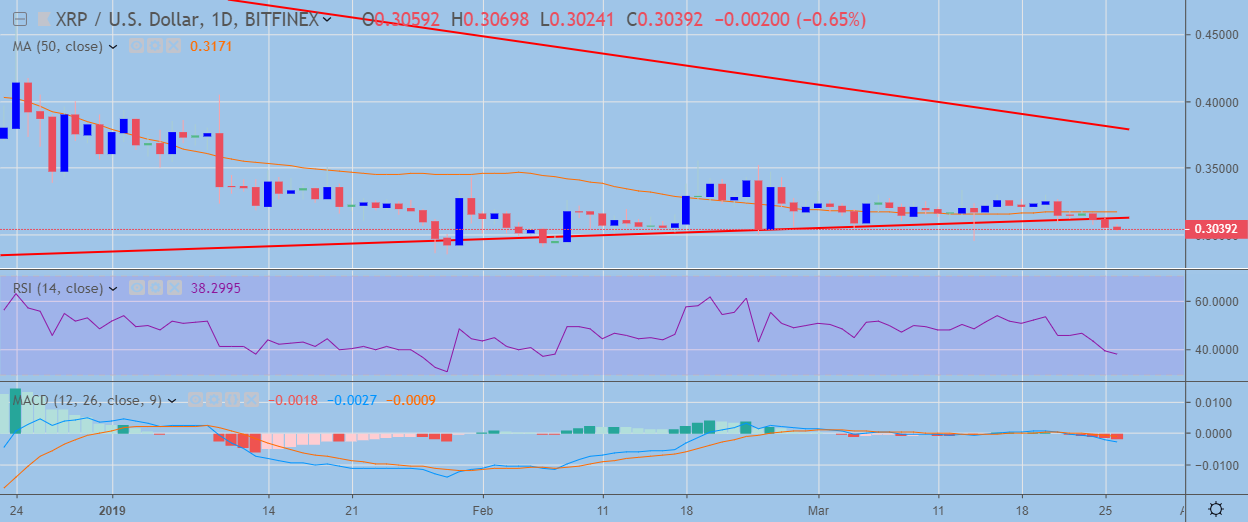
- The medium-term outlook for the XRP / USD pair is bearish, with price now trading under key trendline support
Ripple / USD Short-term price analysis
Ripple has a bearish short-term trading bias, with the XRP / USD pair trading below its 200-period moving average on the four-hour time frame.
A bearish head and shoulders pattern on the four-hour time frame is starting to take shape, with price edging closer to the neckline of the bearish pattern.
The February 24th and March 14th trading lows are the key near-term support areas to watch prior to the neckline of the bearish head and shoulders pattern.

XRP / USD H4 Chart (Source: TradingView)
Pattern Watch
Traders should note that the bearish pattern has a potential downside projection that would take the XRP / USD pair towards levels not seen since November 2017.
Relative Strength Index
The RSI indicator on the mentioned time frame has also turned bearish.
MACD Indicator
The MACD indicator has turned bearish on the four-hour time frame and continues to generate a bearish trading signal.
Ripple / USD Medium-term price analysis
Ripple has a bearish medium-term outlook, with the cryptocurrency now trading below a well-defined triangle pattern on the daily time frame.
The XRP / USD pair is at risk of heavy downside losses while trading below the triangle pattern, with the 0.2540 level now acting as critical technical support below the current yearly trading low.
Technical indicators on the daily time frame are growing increasingly bearish.

XRP / USD Daily Chart (Source: TradingView)
Pattern Watch
Traders should continue to monitor the triangle pattern on the daily time frame as it holds a bearish projection of around $0.30.
Relative Strength Index
The RSI Indicator on the mentioned time frame is also bearish and continues to highlight growing downside pressure.
MACD Indicator
The MACD indicator on the daily time frame is bearish and continues to generate a sell signal.
Conclusion
Ripple is starting to trade under the lower end of its recent trading range, with both the four-hour and daily time frames showing patterns with strong downside projections.
If selling pressure gathers pace below the 0.3000 level technical selling is likely to increase, with the September 2018 trading low offering the last line of defense before a potential technical meltdown.
Check out our introductory course on Ripple and XRP here.
For a more detailed analysis, we also recently published our DARE for the project
Decentral Media, Inc., the publisher of Crypto Briefing, is not an investment advisor and does not offer or provide investment advice or other financial advice. Nothing on this website constitutes, or should be relied on as, investment advice or financial advice of any kind. Specifically, none of the information on this website constitutes, or should be relied on as, a suggestion, offer, or other solicitation to engage in, or refrain from engaging in, any purchase, sale, or any other any investment-related activity with respect to any transaction. You should never make an investment decision on an investment based solely on the information on our website, and you should never interpret or otherwise rely on any of the information on this website as investment advice. We strongly recommend that you consult a licensed investment advisor or other qualified financial professional if you are seeking investment advice on an investment.
Share this article
