 Earn with Nexo

XRP / USD Price Analysis: Last Chance
In this bullish run it will need to at least break its monthly trading high to maintain its positive dynamic.
- Ripple has a bullish short-term trading bias, with the cryptocurrency making a strong recovery above its 200-period moving average
- The XRP / USD pair retains a neutral trading bias over the medium-term
- The daily time frame shows that bulls are attempting to close price above the ascending triangle pattern
Ripple / USD Short-term price analysis
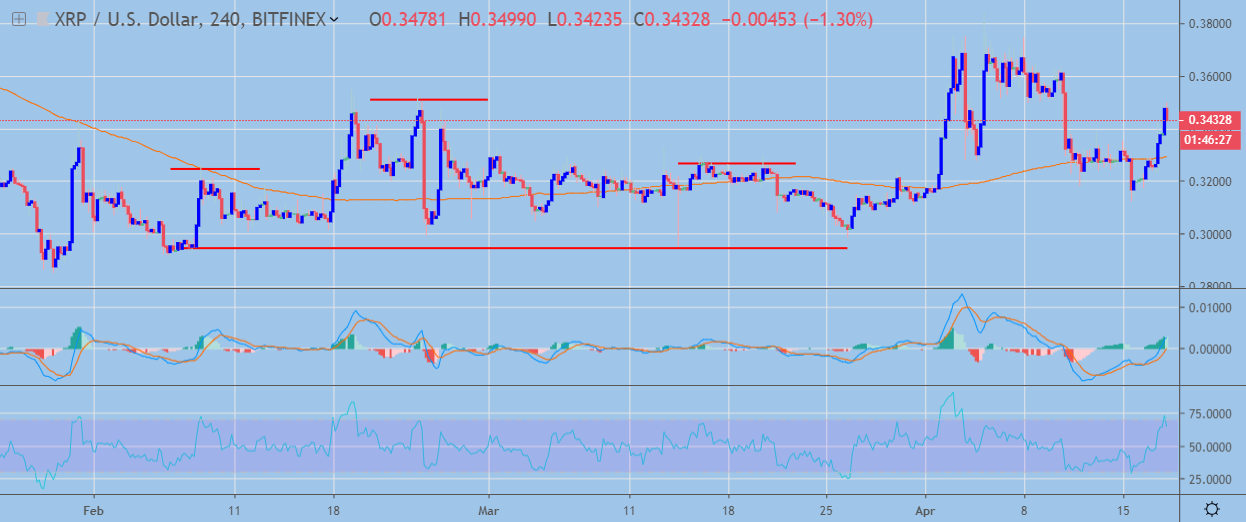
Ripple has a bullish short-term trading bias, with the XRP / USD pair making a strong technical recovery above its 200-period moving average on the four-hour time frame.
The four-hour time frame is showing that bulls are testing back towards the XRP / USD pair’s monthly trading high. Traders should also note that the current 2019 trading high for Ripple is located slightly above the 0.4000 level.
Technical indicators across the four-hour time frame have turned bullish and continue to signal further near-term upside.
 XRP / USD H4 Chart by TradingView
Pattern Watch
XRP / USD bulls now need to move price above the current monthly trading high or an even larger bearish head and shoulders pattern could take shape on the four-hour time frame.
Relative Strength Index
The RSI indicator is bullish on the four-hour time frame, although it is starting to approach overbought territory.
MACD Indicator
The MACD indicator has turned bullish on the four-hour time frame and is generating a buy signal.
Ripple / USD Medium-term price analysis
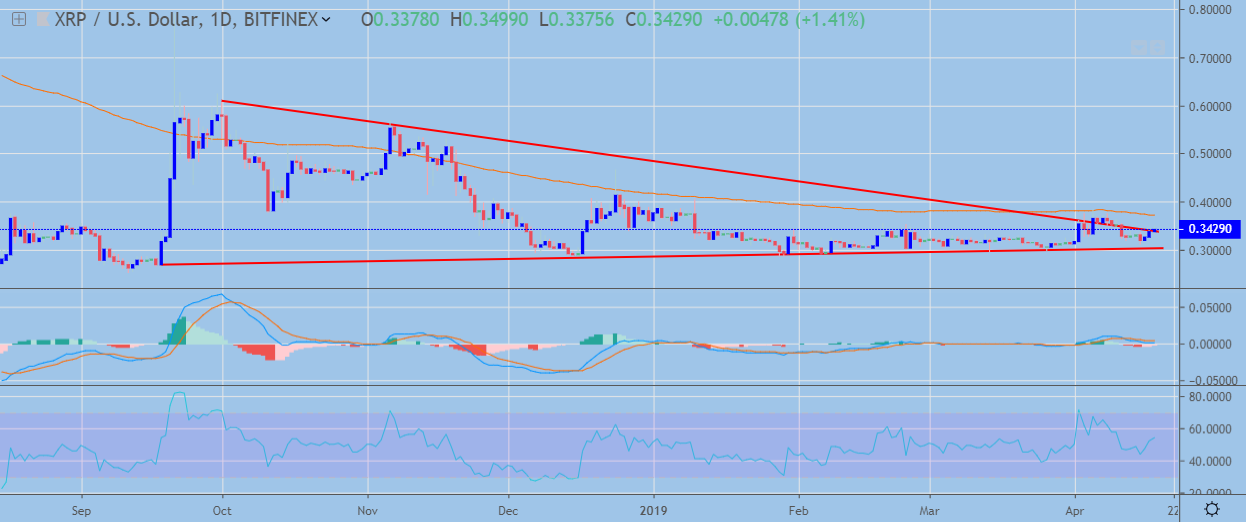
Ripple retains a neutral medium-term trading bias, with the XRP / USD pair’s still unable to close above its trend defining 200-day moving average.
The daily time frame shows that bulls have moved price back towards the top of the large descending triangle pattern. Traders will need to look for multiple daily price closes above the bullish pattern for technical confirmation of a bullish breakout.
Indicators on the daily time frame are attempting to move higher after a brief technical correction lower.
 XRP / USD Daily Chart by TradingView
Pattern Watch
Traders should note that a large inverted head and shoulders pattern could start to take shape if a bullish breakout occurs above the descending triangle pattern.
Relative Strength Index
The RSI indicator on the daily time frame has turned bullish and is highlighting that the XRP / USD pair has scope to trade even higher.
MACD Indicator
The MACD indicator on the daily time is attempting to recover alongside the latest move higher in the XRP / USD pair.
Conclusion
Ripple has staged an impressive recovery and now faces another crucial test from key trendline resistance and also its important 200-day moving average.
The tightening descending triangle pattern on the daily time frame has been hinting for some time that a large directional breakout is nearing. Traders will also be looking for strong technical confirmation of a breakout on the daily time frame, due to the XRP / USD pair’s indecisiveness over recent months.
Check out our coin guide for Ripple and XRP to get a quick view of the project.
We also published a detailed DARE analysis that covers all aspects of the project.