
Stellar Lumen Price Analysis XLM / USD: Turning Point
A double-digit recovery put it at a crossroads.
- Stellar Lumen remains technically bearish across the short and medium-term
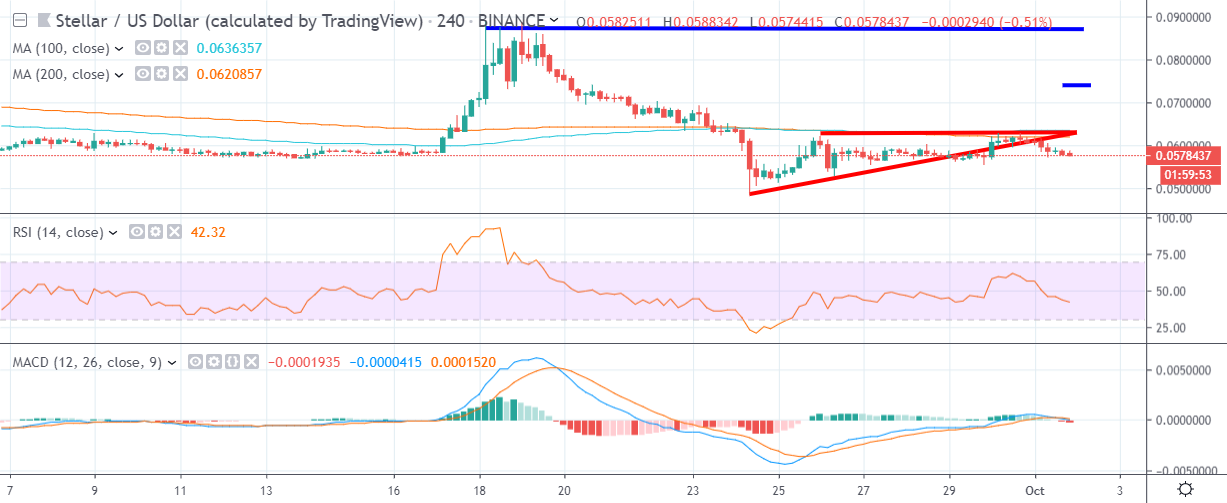
- The four-hour time frame shows that a bearish breakout from an ascending triangle pattern is underway
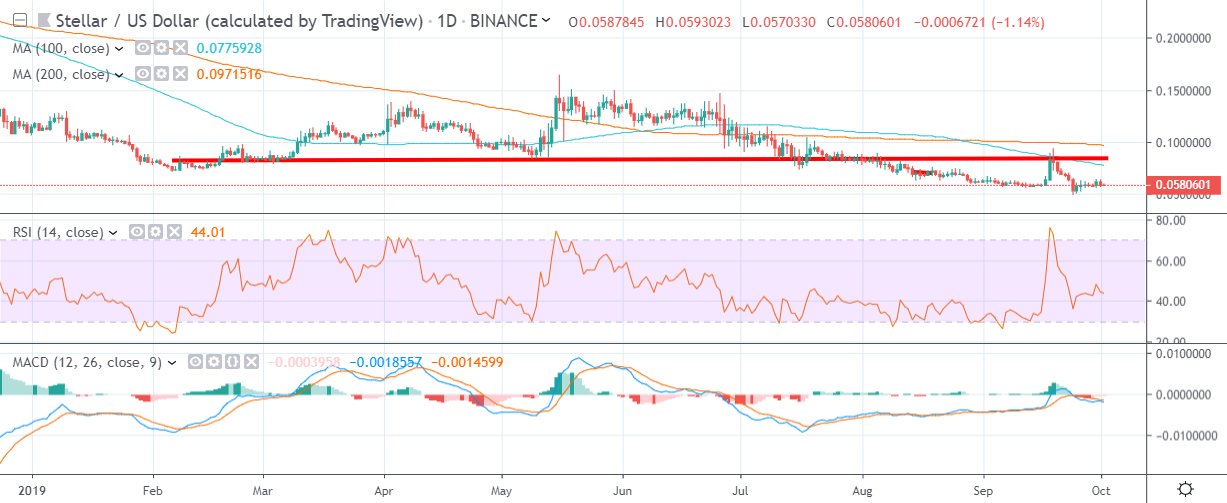
- The daily frame continues to show a head and shoulders pattern in play
Stellar Lumen is attempting to build on recent trading gains, after the cryptocurrency recovered nearly thirty percent in value from the late-September market slump. However, both the four-hour and daily time frames currently warn that it may be too early to call a long-term bottom in the cryptocurrency.
With the entire cryptocurrency market technically bearish and many top coins still pulling lower, the XLM / USD pair still faces a monumental challenge to change its overall trading outlook. Both the four-hour and daily time frames highlight bearish pattern breakouts.
The four-hour time frame shows that a bearish breakout from an ascending triangle pattern has recently occurred, although downside momentum is lacking. Should a bullish reversal occur above the pattern, the upside projection of the pattern suggests a possible recovery towards the $0.074000 level.
Furthermore, the daily time frame is also showing that a huge inverted head and shoulders pattern could start to take shape if the XLM / USD pair recovers towards the June 26th swing-high.
In the near-term, a bearish head and shoulders pattern is currently in play across the daily time frame, with buyers needing to move price above the $0.084000 level to relieve downside pressure.
Going forward, short-term buyers urgently need resume the recent recovery. If an upside recovery is not forthcoming over the coming sessions, the XLM / USD pair risks slumping back towards its current yearly trading-low, around the 0.048800 level.
According to the latest sentiment data from TheTIE.io, the short-term sentiment towards Stellar Lumen is neutral, at 46.00 %, while the overall long-term sentiment towards the cryptocurrency is also neutral, at 48.50%.
Upside Potential
The four-hour time frame highlights that a bullish ascending triangle pattern has formed, if bulls can force a breakout, the upside projection of the pattern extends towards the $0.074000 level.
The four-hour time frame shows that XLM / USD pair’s 50-period and 200-period moving averages are converging around the $0.062500 to $0.063500 area. Bulls must rally price above this key technical area to encourage more short-term action.
Downside Potential
The downside is likely to open up for the XLM / USD pair if the bearish triangle pattern breakout starts to gather momentum. The current yearly trading low is the overall downside objective of the bearish break.
Once below the current trading low, the XLM / USD pair is in a very vulnerable technical position, as the cryptocurrency has almost non-existent long-term support.
Summary
Stellar Lumen has staged an impressive double-digit recovery from its 2019 trading low, which could mark an important long-term price floor.
The XLM / USD pair needs to hold price above the $0.063500 level to inspire a possible rally towards the $0.074000 level. If a rally fails to materialize, the cryptocurrency could come under severe downside pressure.
Check out our coin guide for XLM.
Our analyst team also covered Stellar, offering a deep look into the project.