Tezos Price Analysis XTZ / USD: Turbulent Climb
Strong recovery, but the fall was even stronger.

Share this article
- Tezos has a bearish short-term bias, with the XTZ / USD pair trading below its 200-period moving average on the four-hour time frame
- The four-hour time frame continues to show a bearish head and shoulders pattern
- The daily time frame shows that price is testing the neckline of a large inverted head and shoulders pattern
Tezos / USD Short-term price analysis
Tezos has a bearish short-term bias, with the XTZ / USD pair trading below its key 200-period moving average on the four-hour time frame.
The four-hour time frame continues to show a bearish head and shoulders pattern, with the XTZ / USD pair staging a strong rebound from neckline support.
Technical indicators are rising on the four-hour time frame and are issuing a strong buy signal.
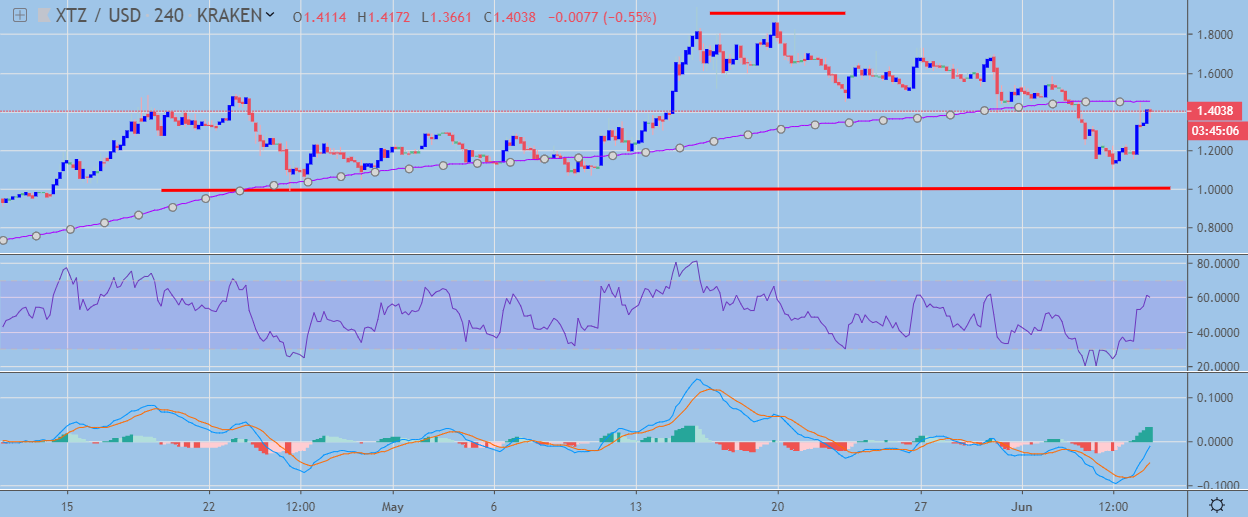 XTZ / USD H4 Chart by TradingView
Pattern Watch
Traders should note that if the bearish head and shoulders pattern is triggered the XTZ / USD pair could fall towards the current 2019 trading low.
Relative Strength Index
The RSI indicator remains bullish on the four-hour time frame and continues to issue a buy signal.
MACD Indicator
The MACD indicator is bullish on the four-hour time frame and is generating a strong buy signal.
Tezos / USD Medium-term price analysis
Tezos has a bullish medium-term trading outlook, with the XTZ / USD pair still trading well above its trend defining 200-day moving average.
The daily time frame is showing that bulls are testing back towards the neckline of the large inverted head and shoulders pattern, following a false breakout above the bullish pattern.
Technical indicators across the daily time frame are still bearish despite the recent recovery higher.
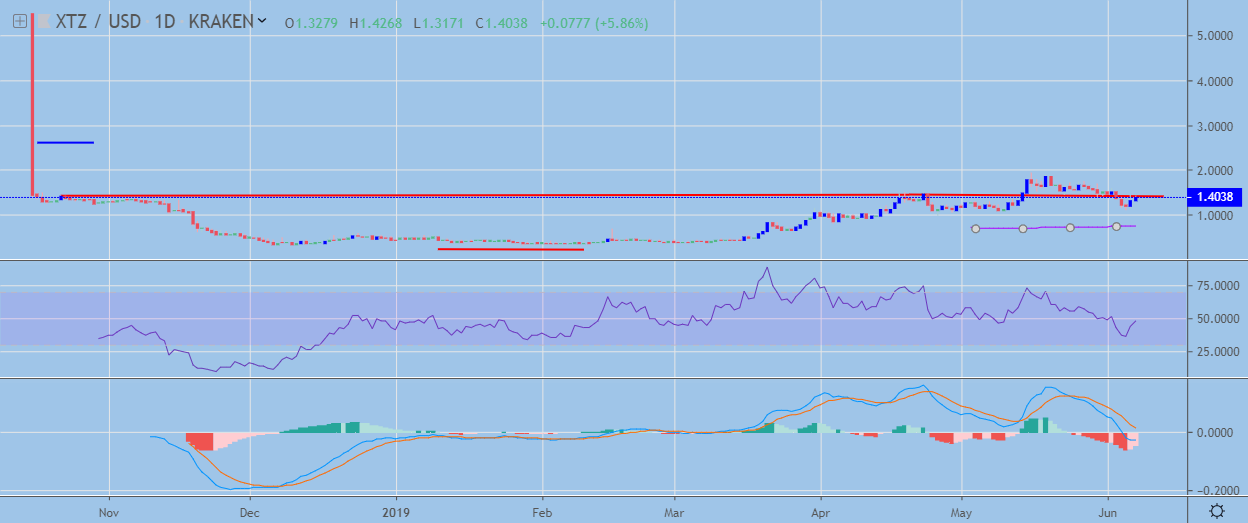 XTZ / USD Daily Chart by TradingView
Pattern Watch
Traders should note that the 2.6000 level still remains the initial upside target of the bullish inverted head and shoulders pattern on the daily time frame.
Relative Strength Index
The Relative Strength Index is attempting to recover higher on the daily time frame, although it still remains bearish.
MACD Indicator
The MACD indicator on the daily time frame is bearish and is currently issuing a sell signal.
Conclusion
Tezos still has an uncertain short-term outlook, with the bearish pattern on the four-hour time frame highlighting that further downside in the XTZ / USD pair still remains possible.
The medium-term outlook for the cryptocurrency appears more bullish, with the inverted head and shoulders on the daily time frame still pointing to a potential move towards the 2.6000 level.
Check out what Tezos is baking in our coin guide.
Share this article
